ORB strategy Newyork Time

08/12/2025
5
Desktop
منذ 02/12/2025
التثبيتات المجانية
5
The New York ORB Indicator is an essential tool for traders focusing on the US Market Open (Indices like NAS100, US30, SPX500, or US Stocks). It automatically calculates and draws the "Opening Range" defined by the High and Low of the first 15 minutes of the New York session.
Unlike standard indicators that rely on Server Time, this tool automatically converts your chart to Eastern Standard Time (New York). Whether your broker is in London, Cyprus, or Sydney, the box will always draw correctly at 9:30 AM EST.
How it works:
- It identifies the start of the US Session (09:30 EST).
- It calculates the Highest High and Lowest Low up to 09:45 EST.
- It draws a shaded box projecting these levels forward to the market close (16:00 EST), allowing you to easily spot breakouts and retests throughout the day.
Key Features:
- Timezone Aware: Automatically handles the conversion to US Eastern Time (detects Daylight Savings).
- Visual Clarity: Draws a customizable, transparent shaded box for the trading session.
- Fully Customizable: Change the Start Time, End Time, Session Close, Colors, and Opacity to fit your strategy (e.g., change to a 30-minute ORB easily).
- Clean Charts: Only draws the box once the range is complete.
Parameters (Settings):
- ORB Start (NY Time): Default 09:30 (Market Open).
- ORB End (NY Time): Default 09:45 (The initial range).
- Session End (NY Time): Default 16:00 (When the box stops drawing).
- Box Color: Choose your preferred color from the picker.
- Opacity: Adjust transparency (0–255) so it doesn't obscure your candles.
Recommended Timeframes: Works best on M1, M5, or M15 charts.
0.0
التقييمات: 0
تقييمات العملاء
لا توجد تقييمات لهذا المنتج حتى الآن. هل جرَّبته بالفعل؟ كن أول من يخبر الآخرين!
قد يعجبك أيضًا
مؤشر
Forex
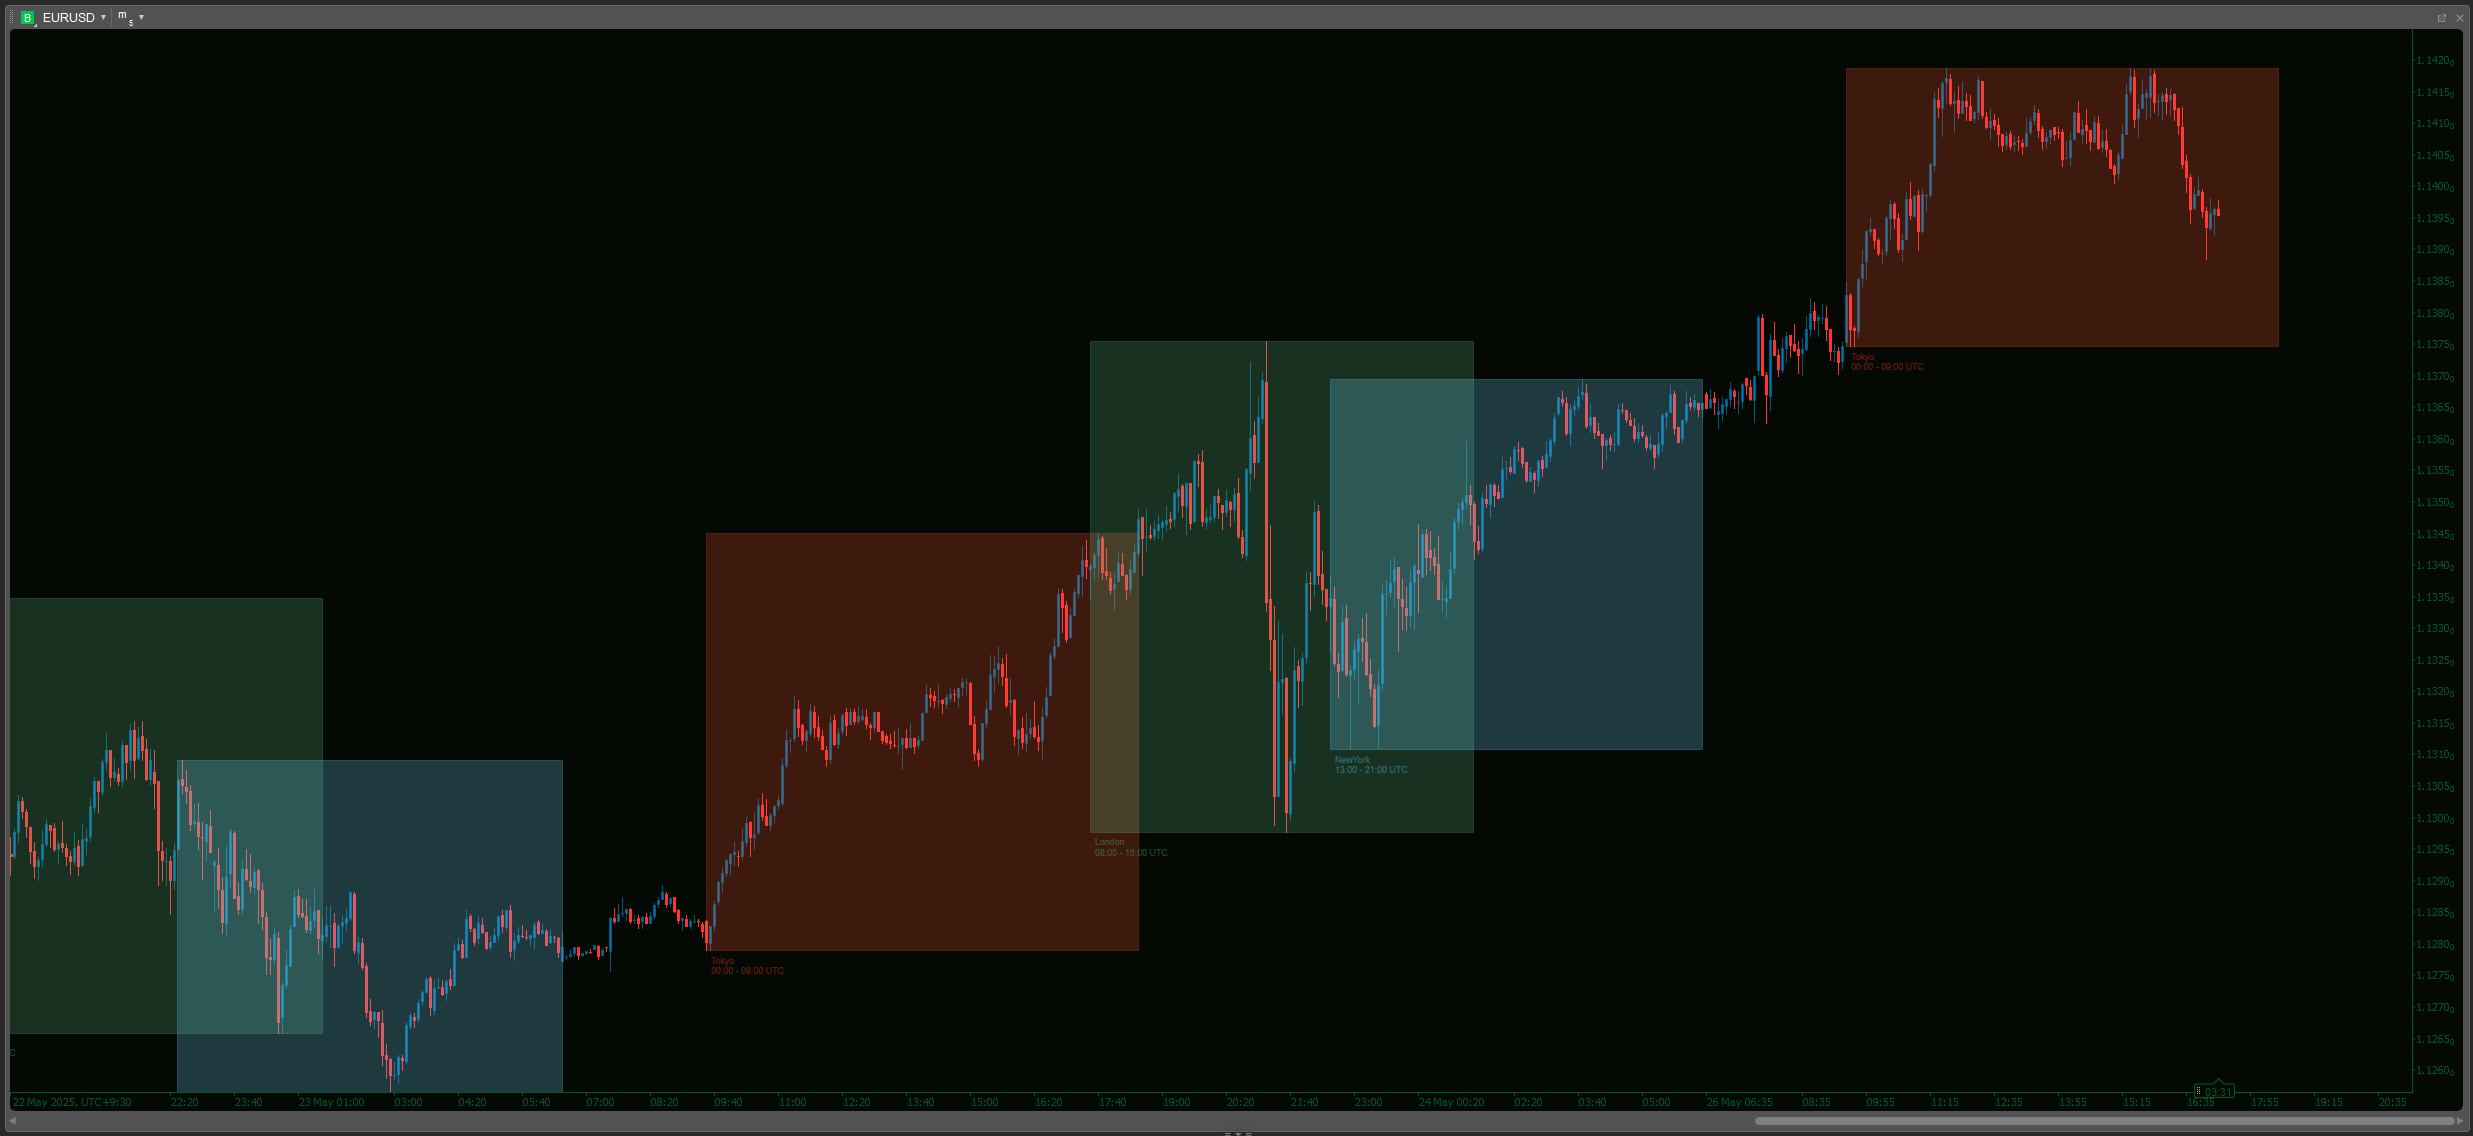
Market Sessions V2_NSC
Market Session V2: Full Control. colors, history, session/text toggles, font size. Elevate your strategy!

![شعار "[Stellar Strategies] Visual Trend Momentum"](https://market-prod-23f4d22-e289.s3.amazonaws.com/3835d044-1c21-4909-9d3c-2635f984b93d_visualtrendmomentum.jpg)
![شعار "[Stellar Strategies] MARSI Signal Plotter"](https://market-prod-23f4d22-e289.s3.amazonaws.com/ce01bd9f-8907-48d9-a68d-7c0bde6b9704_4aDZjo80P5.png)

![شعار "[Stellar Strategies] Linear Regression Candles 1.1"](https://market-prod-23f4d22-e289.s3.amazonaws.com/19ef277f-e0b6-48ef-8941-88bfbba145f3_cT_cs_4141285_EURUSD_2025-03-30_19-53-31.png)
.png)
.jpg)
.jpg)