

Description
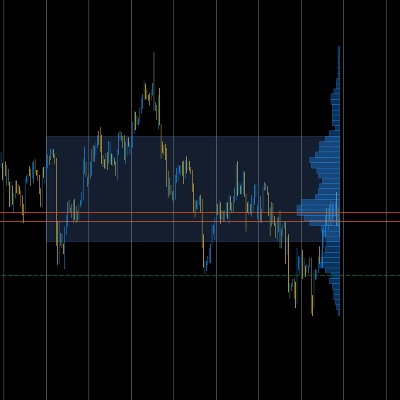
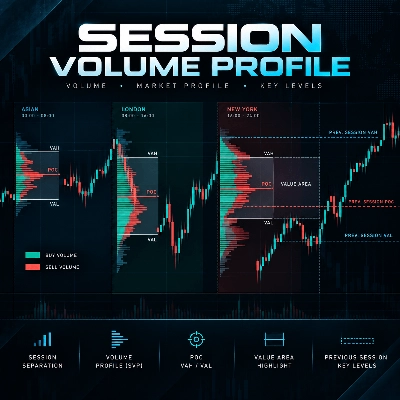
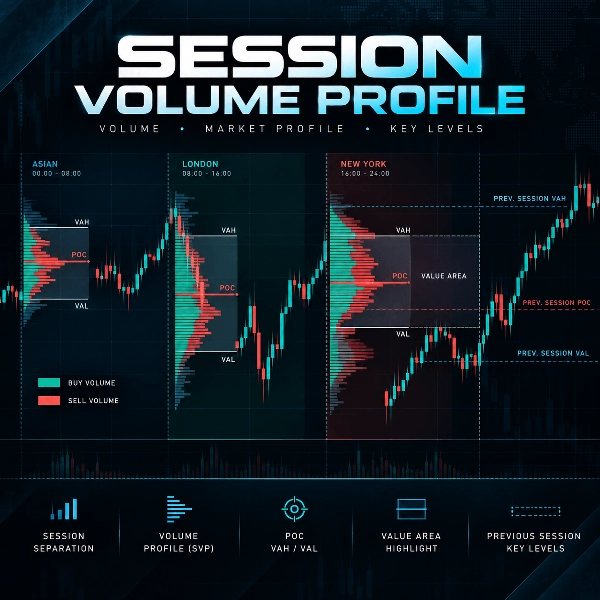
Session Volume Profile that builds a separate profile for each trading session and automatically extends POC, VAH and VAL levels into the future until price touches them. It is designed for traders who want futures‑style volume analysis on CFD and forex markets, without paying for expensive exchange data.
What this indicator does
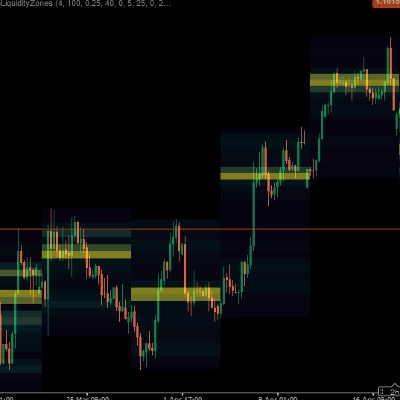
-Plots a session-based Volume Profile using tick volume for each trading day or custom session.
-Separates buy and sell activity per price level using candle direction, showing green (buy) and red (sell) volumes in each row.
-Automatically calculates POC (Point of Control) as the price level with the highest activity in the session.
-Draws Value Area (VA) based on a configurable percentage (default 70%), with clear VAH (Value Area High) and VAL (Value Area Low) boundaries.
-Extends POC, VAH and VAL horizontally to the right after the session closes and keeps them on the chart until the market retests these levels.
-Detects trading hours from the symbol’s Market Hours or lets you define custom session times.
-Displays multiple sessions on the same chart, with optional vertical separators.
-Offers full customization of colors, opacity, row count, histogram width and side (left or right).
This makes it a compact “session map” of market participation, highlighting key support and resistance zones derived from volume distribution rather than just price swings.
How it works (in simple terms)
For each session, the indicator measures the tick volume of every candle and distributes it across price rows between the high and the low of the bar. Tick volume is the number of price updates, which in liquid markets is a very good proxy for real traded activity. The result is a horizontal histogram that shows where the market has spent the most energy during that session.
-From this distribution the indicator then:
-Finds the POC (maximum volume row).
-Builds a Value Area around the POC until it contains the chosen percentage of total session volume (70% by default).
-Marks VAH/VAL as the top and bottom of this area, which are widely used as potential support/resistance in volume profile theory.
-After the session closes, POC/VAH/VAL are projected forward as extended horizontal lines. Each line remains active until the first time price touches it; this makes them powerful reference levels for mean reversion, reversals or continuation setups.
Trading use cases
You can use Session Volume Profile to:
-Identify high‑volume “fair value” zones and low‑volume rejection zones for intraday or swing trading.
-Trade tests of extended POC as potential magnets or decision points where the market can react strongly.
-Use VAH and VAL extensions as dynamic session-based support and resistance boundaries.
-See where buyers or sellers were more aggressive inside a session thanks to the buy/sell split.
-Combine session levels from previous days with your own price action, orderflow or liquidity concepts on CFD/forex charts.
The indicator works well on forex, indices, commodities and crypto CFDs and is most useful on intraday timeframes (M5–H1), but can also be applied to higher timeframes for swing traders.
Tick volume vs real volume: a practical compromise
CFD and spot forex markets do not expose centralized “real” exchange volume. This indicator uses tick volume (the number of price changes) as a proxy for trading activity. While this is not the same as true futures volume, practical comparisons show that tick volume profiles often produce very similar POC, VAH and VAL zones to those obtained from exchange data, especially on liquid instruments.
You should think of tick volume as an approximation of real traded volume:
It does not show exact size of contracts, but it captures where the market is most active.
It is broker‑dependent, but still a highly informative “activity map” for day‑to‑day trading.
This makes Session Volume Profile a cost‑effective alternative to professional futures feeds. You can bring
the core logic of volume profile and market profile into your cTrader CFD charts at a fraction of the cost of specialized orderflow platforms.
Key features
Indicator type: Volume / Market Profile based on tick volume.
Sessions: auto‑detected from symbol Market Hours or fully customizable.
Levels: POC, VAH, VAL calculated per session and extended until touched.
Display: buy/sell split, histogram rows (10–200), adjustable width and side.
Instruments: forex, indices, commodities, crypto CFDs (any symbol with tick volume).
Timeframes: works on all timeframes, recommended M5–H1 for intraday.
Summary
SVP detects trading sessions based on the symbol’s market hours or allows custom session definitions. It supports multiple sessions on one chart with optional vertical separators and offers extensive customization of colors, opacity, histogram rows (10–200), width, and display side.
The indicator works on forex, indices, commodities, and crypto CFDs, suitable for all timeframes but recommended for intraday (M5–H1). It uses tick volume as a proxy for real traded volume, providing a cost-effective alternative to futures exchange data. Traders can identify high-volume fair value zones, low-volume rejection areas, and use extended POC, VAH, and VAL levels as dynamic support and resistance for intraday or swing trading strategies.
Customer reviews
5 | 50 % | |
4 | 50 % | |
3 | 0 % | |
2 | 0 % | |
1 | 0 % |