present
Sign up and get $50 off your first purchase
Trading product for BubbleXRay Indicator Key Levels Liquidity Sweep, image 1
BubbleXRay
Indicator
20 purchases
Version 1.2, Aug 2026
Windows, Mac
4.3
Reviews: 3
Trading product for BubbleXRay Indicator Key Levels Liquidity Sweep, image 2
Trading product for BubbleXRay Indicator Key Levels Liquidity Sweep, image 3
Trading product for BubbleXRay Indicator Key Levels Liquidity Sweep, image 4
Trading product for BubbleXRay Indicator Key Levels Liquidity Sweep, image 5
Trading product for BubbleXRay Indicator Key Levels Liquidity Sweep, image 6
Trading product for BubbleXRay Indicator Key Levels Liquidity Sweep, image 7
Trading product for BubbleXRay Indicator Key Levels Liquidity Sweep, image 8
Trading product for BubbleXRay Indicator Key Levels Liquidity Sweep, image 9
Since 09/02/2026
25
Sales
166
Free installs

Description

BUBBLEXRAY — THE ULTIMATE BUBBLE VOLUME X-RAY FOR CTRADER ( VERSÃO 🇧🇷 ABAIXO)

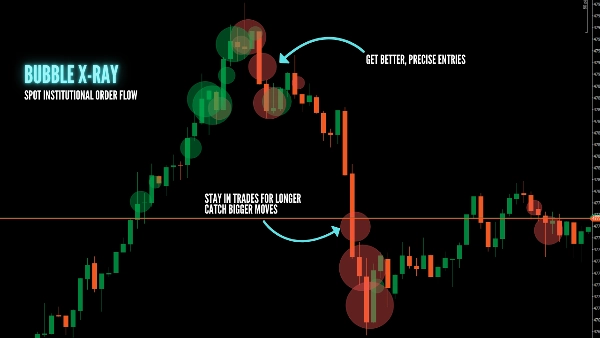
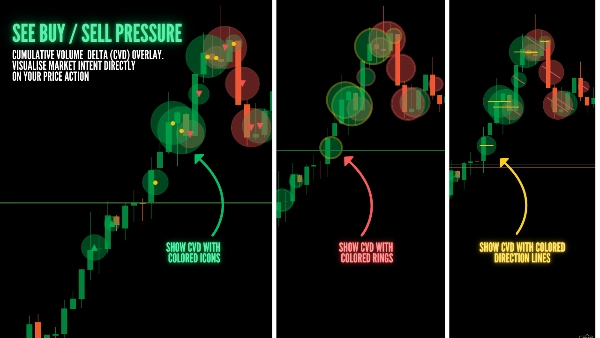
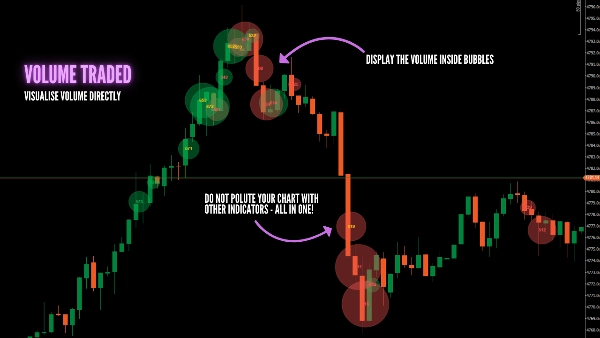
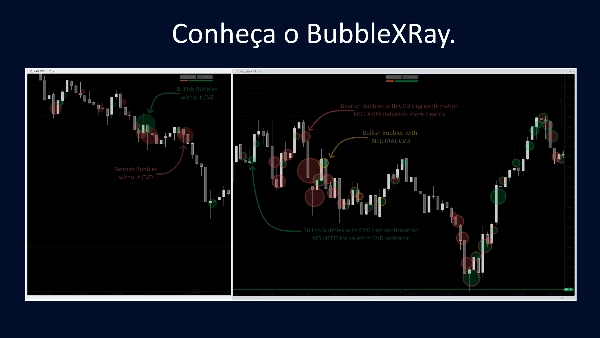
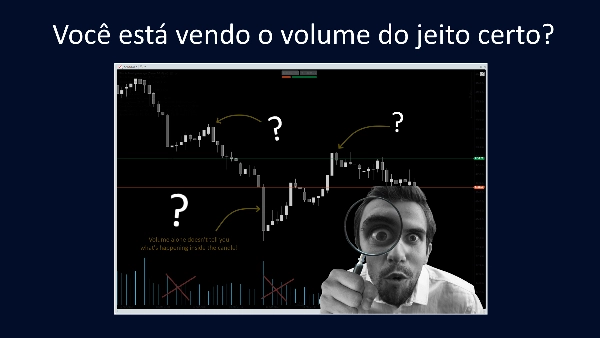
Spot where the real money moves. BubbleXRay identifies high-volume spikes and renders them as proportional bubbles directly on your price action. Display the cumulative volume delta (CVD) change integrated into a single indicator, without cluttering or polluting your chart. No more guessing—see institutional footprints the moment they happen.

✅ WHY USE BUBBLEXRAY?

  • Instant Activity Spikes: Bubbles form the second a high-volume bar closes.
  • Institutional Footprints: Large bubbles at key levels reveal where big players are active.
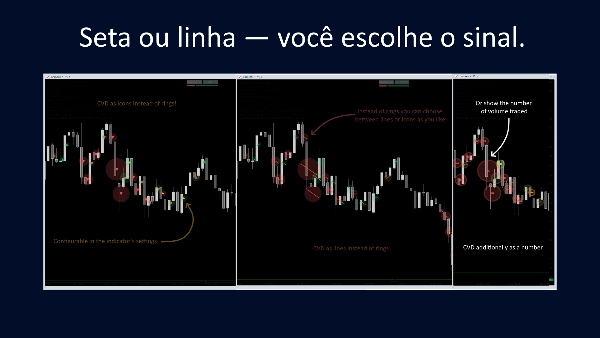
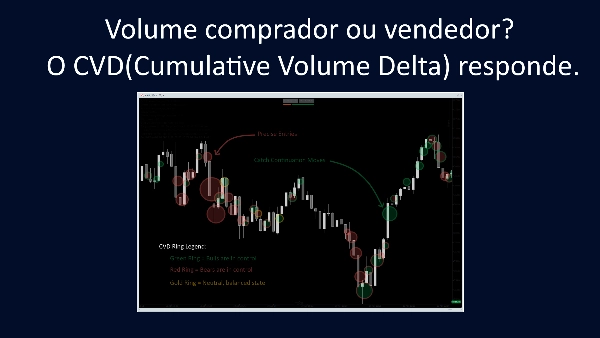
  • CVD Intelligence: Integrated Cumulative Volume Delta shows if the surge was Buying or Selling pressure.
  • Auto-Scaling: The rolling percentile window adapts to any market condition (Trending or Ranging).
  • Price-Anchored: Volume is shown at the exact price level, not hidden in a sub-pane histogram.

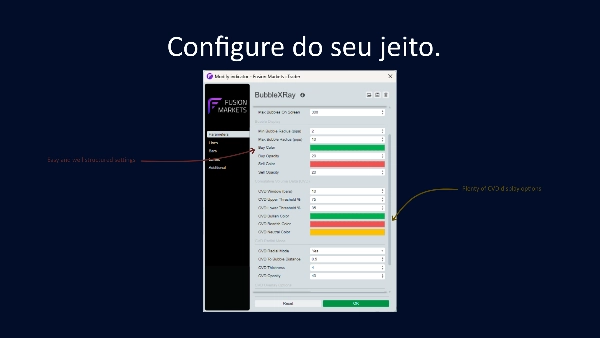
Preset Example: Gold (XAUUSD) - 1M Chart

  • Volume Percentile Threshold: 50
  • Percentile Window (bars): 250
  • Max Bubbles on Screen: 20
  • Min Bubbles Radius (pips): 5 ➡ (example for EUR/USD: 0.1)
  • Max Bubbles Radius (pips): 20 ➡ (example for EUR/USD: 0.8)
  • CVD Rolling Period (bars): 10
  • CVD Slope Lookback (bars): 7
  • CVD Flat Factor: 1.8
  • CVD Radial Mode: No
  • CVD To Bubble Distance: 0.5
  • CVD Thickness: 4
  • CVD Opacity: 40
  • CVD Overlay Options: No
  • Debug Mode: No

📺 WATCH THE TUTORIAL & JOIN THE COMMUNITY:


(Please post your questions/support requests in the video comments to help our community grow!)

🛠️ KEY FEATURES:

  • Proportional Sizing: Bubble size scales linearly with volume magnitude.
  • Dual Confirmation: Combine the Radial Ring and Overlay Arrow for deeper CVD context.
  • Zero Configuration: Automatically selects the best data feed timeframe for your chart.
  • Clean UI: Configurable opacity and display caps to keep your charts professional.

🇧🇷 BUBBLEXRAY — O RAIO-X DE VOLUME DEFINITIVO PARA CTRADER

Identifique onde o "Smart Money" está atuando. O BubbleXRay marca picos de alto volume com bolhas proporcionais diretamente no preço. Exiba a variação acumulada do volume (CVD) integrada em um único indicador, sem sobrecarregar ou poluir seu gráfico.Chega de dúvidas: veja o rastro institucional no momento em que ele ocorre.

✅ POR QUE USAR O BUBBLEXRAY?

  • Picos de Atividade Instantâneos: As bolhas surgem assim que uma barra de alto volume fecha.
  • Rastros Institucionais: Bolhas grandes em níveis-chave revelam a atuação de grandes players.
  • Inteligência CVD: O Delta de Volume Acumulado integrado mostra se a pressão foi de Compra ou Venda.
  • Auto-Ajustável: O sistema de percentil se adapta a qualquer mercado (Tendência ou Lateralização).
  • Ancorado ao Preço: O volume é exibido no nível exato da ação, não escondido em histogramas inferiores.

📺 ASSISTA AO TUTORIAL E TIRE SUAS DÚVIDAS:


(Por favor, poste suas dúvidas e pedidos de suporte nos comentários do vídeo acima, assim ajudamos ao máximo de pessoas!)

🛠️ DESTAQUES TÉCNICOS:

  • Tamanho Proporcional: O raio da bolha escala conforme a magnitude do volume.
  • Confirmação Dupla: Use o Anel Radial e a Seta Interna para um contexto profundo de CVD.
  • Configuração Zero: Seleciona automaticamente o melhor timeframe de dados para seu gráfico.
  • Interface Limpa: Opacidade e limites de exibição configuráveis para manter seu setup profissional.


Summary

AI summary
BubbleXRay is a volume-based trading indicator designed for the cTrader platform that visualizes institutional order flow through proportional volume bubbles directly on price charts. It highlights high-volume spikes as bubbles sized according to volume magnitude, enabling traders to identify where significant market participants are active. The indicator integrates Cumulative Volume Delta (CVD) data to distinguish buying versus selling pressure, providing deeper insight into volume dynamics without cluttering the chart. Key features include instant detection of volume spikes upon bar close, auto-scaling via a rolling percentile window adaptable to trending or ranging markets, and price-anchored volume display rather than separate histograms. Additional functionalities include dual confirmation using radial rings and overlay arrows for enhanced CVD context, zero-configuration automatic timeframe selection, and customizable opacity and display limits for a clean user interface. The indicator supports analysis of key market structure concepts such as key levels, liquidity sweeps, imbalances, supply and demand zones, and support/resistance. A preset example configuration is provided for Gold (XAUUSD) on a 1-minute chart. A tutorial video is available to assist users in setup and application. BubbleXRay requires volume and tick data and outputs visual signals directly on price charts.
Indicator profile
Indicator category
Volume
Output type
Visualisation
Data requirements
Volume
Tick data
Bars only

Customer reviews

4.3
Reviews: 3
5
33 %
4
67 %
3
0 %
2
0 %
1
0 %
Customer reviews
April 25, 2026
the signal needs a real reason behind it, but one oversized trade can ruin the day.
April 20, 2026
It becomes more useful when it makes overtrading easier to notice. Size control still matters.
April 16, 2026
The first 10 trades should stay boring. Bad setups become easier to pass on, and the chart still needs a final look.

Discussion

FAQ
Key Levels
Liquidity Sweep
Imbalance
Volume
Supply & Demand
Liquidity Grab
Support & Resistance
Products available through cTrader Store, including trading bots, indicators and plugins, are provided by third-party developers and made available for informational and technical access purposes only. cTrader Store is not a broker and does not provide investment advice, personal recommendations or any guarantee of future performance.

More from this author

Indicator
BOS
CHOCH
+5
Spot market structure shift with ease, overlay timeframes, avoid false breakouts with open close pivots, hide chart bars
Indicator
Forex
EURUSD
+5
Fimathe Indicator - Fimathe PCM - Automated Trend Channels & Levels — Ideal for live trading and backteting
Indicator
CHOCH
Key Levels
+5
ZigZag Market Structure Identifier - Multi-Layer Scanner: Convergent Pivot Detection, 4-TF Overlay & Naked Chart Mode.
cBot
Fixed Lot
TP Manager
+5
Hotkeys Trading Assistant - Professional Shortcut Assitant with Risk Manager, Hotkeys & Lot Sizing.
Indicator
Key Levels
Break & Retest
+5
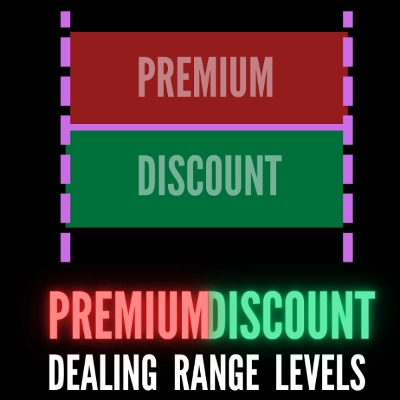
Premium Discount Levels - Professional Dealing Range Zones with Draggable Lines, Alerts, Wartermark & Backtest Mode.
Desktop plugin
Risk/Reward
Trade Journal
+5
cTrader Journal - Automatic Trade Capture. Offline Reviews. No Subscription.
Indicator
CHOCH
Inducement
+5
TradeLens - Frame the Trade. Refine the Entry. Two Timeframes. One Decision.
Indicator
Key Levels
Order Block
+5
FVG Levels — Auto-Detection of Multi-Timeframe Fair Value Gaps & GAPs, Smart Filters and Liquidity Zone Monitoring

You may also like

Indicator
Prop
Forex
+13
🎯Automatically detects and visualizes classical chart patterns using multi-timeframe swing point analysis.
Indicator
MACD
Forex
+6
Auto Signal BUY SELL is a professional decision-making tool designed to help you follow the trend and capture high-proba
Indicator
RSI
Breakout
+1
"Identify key market zones and visualize support/resistance from multiple timeframes on a single chart.
Indicator
MACD
Prop
+14
Customize the MACD! Choose colors, get real-time tick updates, and see crossover points for enhanced trading precision.
Indicator
ATR
RSI
+16
This trading game allows you to explore and practice investment strategies in a real-time market data environment.
Indicator
Forex
BTCUSD
+8
The traditional Hull Moving Average with different colours based on the slope (direction) of the trend.
Indicator
Supertrend-based channel for entries, trailing stops, and dynamic support/resistance zones.
Indicator
Crypto
Signal
+3
Candlestick Signal Finder: cTrader indicator that automatically detects and color-codes key Japanese candlestick pattern
Indicator
Forex
BTCUSD
+5
This indicator displays the OrderBlocks of the current and higher timeframe, made by ICT's student.
Indicator
VWAP
NAS100
+5
Key NY session opens for NASDAQ (US100) & SP500 to find Tick Precise Entrys for High R:R intraday setups.
Indicator
Forex
BTCUSD
+5
Auto-plots Open, High, and Low of Day/Week/Month/Year. Session candle counter + Round Numbers. Fully customizable
Indicator
Forex
BTCUSD
+11
Auto-detects Bullish/Bearish Engulfing patterns to spot trend reversals. Real-time alerts, custom colors, all symbols.
Indicator
ATR
BOS
+5
Clean Smart Money zones with filtered FVGs, confirmed BOS, Order Blocks, and automatic mitigation tracking.
Indicator
RSI
RSI on the main chart with 45/55 momentum levels, overbought/oversold levels, averaged RSI, and multi-timeframe support.
Indicator
Channel
Imbalance
+2
Adaptive volatility channel based on moving average and standard deviation (σ).
Indicator
Master RSI reversals with Parabolic SAR precision! Get real-time alerts for high-probability trend changes.
Indicator
ADX
ATR
+1
Indicador de Sinais Visuais para Spotcrude (WTI) ou SpotBrent com filtros de tendência, operacional de 10 e 15 minutos.
Indicator
ADX
ATR
+2
GOLD SENTINEL v1.0 - A CANDLE-COLORING INDICATOR FOR GOLD.

Price

Since 09/02/2026
25
Sales
166
Free installs