MultiMAIndicator_Optimized
مؤشر
1 عمليات الشراء
الإصدار 1.0، Jun 2025
Windows, Mac
4.0
التقييمات: 4
الوصف
تكوين المؤشرات المتعددة
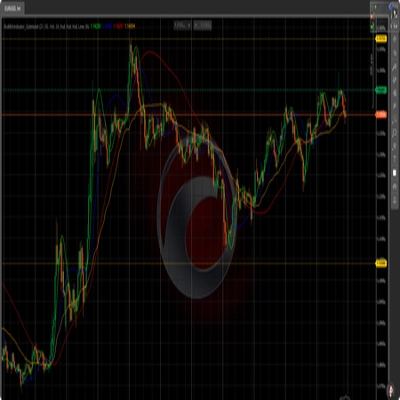
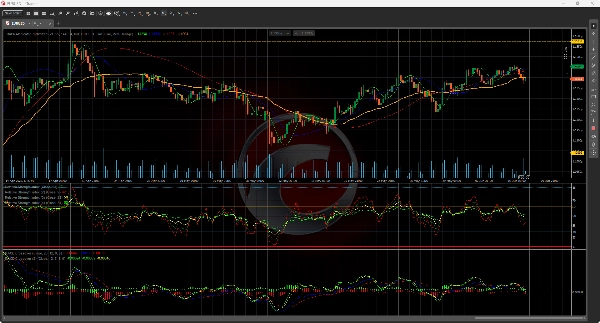
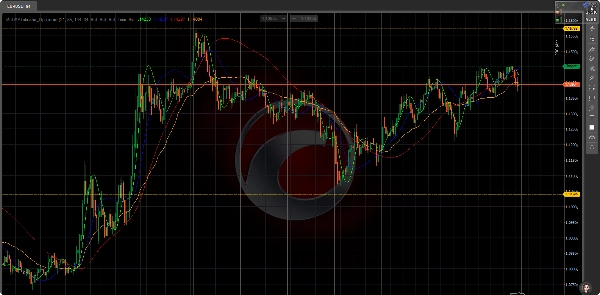
الرسم البياني الرئيسي
يعرض 3 متوسطات متحركة هول (HMA) و 1 متوسط متحرك موزون بالحجم (VWMA)
الرسم البياني الفرعي الأول
يعرض مؤشر RSI مع مستويات التشبع الشرائي/البيعي (عتبات 70/30)
الرسم البياني الفرعي الثاني
يعرض مؤشر MACD بما في ذلك خط الإشارة والهيستوجرام
المصطلحات الرئيسية
المتوسط المتحرك هول (HMA):
متوسط متحرك متقدم يقلل التأخير من خلال حسابات السعر الموزون
المتوسط المتحرك الموزون بالحجم (VWMA):
مؤشر تأكيد السعر موزون بحجم التداول
مستويات التشبع الشرائي/البيعي:
عتبات RSI القياسية (70 = تشبع شرائي، 30 = تشبع بيعي)
هيستوجرام MACD:
تمثيل بصري لتباعد/تقارب الزخم
الملخص
ملف تعريف المؤشر
تقييمات العملاء
4.0
التقييمات: 4
5 | 25 % | |
4 | 50 % | |
3 | 25 % | |
2 | 0 % | |
1 | 0 % |
تقييمات العملاء
June 23, 2025
pretty decent as a helper. Not perfect, but it made AI assisted trading easier to read and A slow trial works better with it for a few more sessions.
June 22, 2025
tested like a normal trader would, small size first. The idea is fine, but it is not worth trying to scale it before seeing how it handles bad days. Manual review still matters here.
June 21, 2025
This fits AI assisted trading better as a review layer. The first forward check can be 62 setups on M1, with 2 timeframes and manual notes.
June 17, 2025
feels right for a user who wants less noise in the process. The best use is checking market bias, then leaving the final filter manual. Better rechecked it on 30 days.
مناقشة
الأسئلة الشائعة
Signal
RSI
MACD
يتم توفير المنتجات المتاحة من خلال cTrader Store، بما في ذلك روبوتات التداول والمؤشرات والإضافات، من قبل مطوري الطرف الثالث وإتاحتها لأغراض الوصول المعلوماتي والفني فقط. cTrader Store ليس وسيطًا ولا يقدم نصائح استثمارية أو توصيات شخصية أو أي ضمان للأداء المستقبلي.
قد يعجبك أيضًا


السعر
منذ 03/04/2025
1.71B
حجم التداول
556.96K
الربح بالبيب
1
المبيعات