
Deskripsi
Masalah: Kelebihan Informasi
Kebanyakan trader gagal karena grafik mereka penuh dengan indikator yang tertinggal dan terlalu banyak garis. Mereka kehilangan fokus pada hal yang paling penting: Struktur Pasar.
Solusi: Struktur Bias Tren
Indikator ini adalah kekuatan "Dua-dalam-Satu" untuk platform cTrader. Ini menggabungkan Deteksi Ayunan profesional dengan Mesin Skoring objektif yang memberi tahu Anda dengan tepat siapa yang mengendalikan pasar.
Fitur Utama:
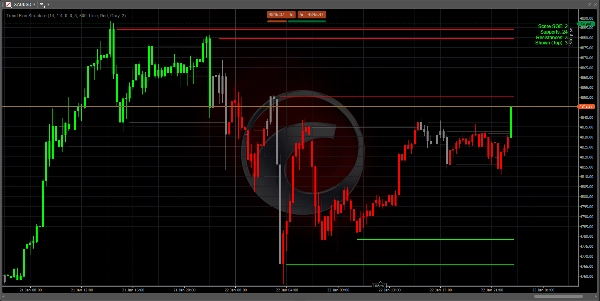
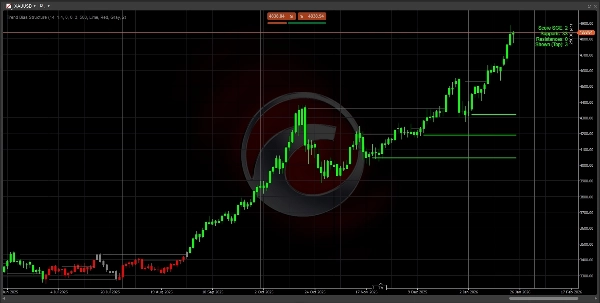
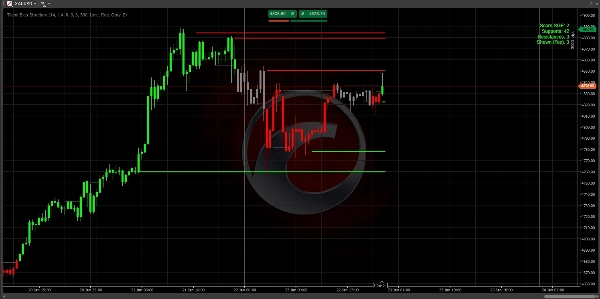
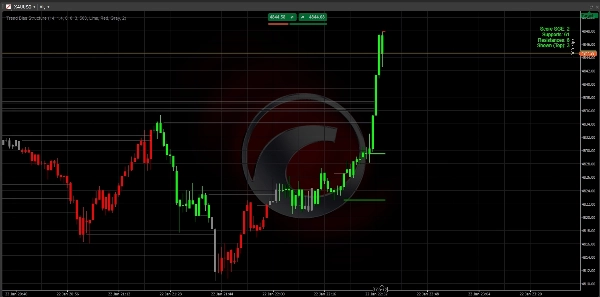
- Pemetaan Struktur Cerdas: Secara otomatis mengidentifikasi level Support dan Resistance penting menggunakan volatilitas yang difilter ATR.
- Mesin Skoring SGE: Sistem penilaian unik (-2, 0, +2) yang menghitung kekuatan tren berdasarkan berapa banyak level struktural yang telah ditembus.
- Teknologi Anti-Keramaian: Hanya menampilkan 3 level relevan terdekat dengan harga saat ini. Grafik Anda tetap bersih, profesional, dan dapat ditindaklanjuti.
- Deteksi Momentum: Menggunakan logika "Lilin Besar" untuk memastikan Anda hanya berdagang pada pergerakan dengan dukungan institusional nyata.
- Sepenuhnya Dapat Disesuaikan: Sesuaikan sensitivitas untuk aset spesifik Anda (XAUUSD, Forex, atau Indeks).
Cara Berdagang dengan Ini:
- Periksa Skor: Cari +2 (Bullish) atau -2 (Bearish).
- Tunggu Tarikan Kembali: Biarkan harga kembali ke salah satu Garis Struktur yang digambar.
- Eksekusi: Berdagang dengan bias, menggunakan level sebagai jangkar masuk/keluar Anda.
Spesifikasi Teknis
- Platform: cTrader
- Bahasa: C# (.NET)
- Kerangka Waktu: Bekerja pada semua kerangka waktu (M1 hingga Bulanan).
- Aset: Dioptimalkan untuk pasangan dengan likuiditas tinggi (XAUUSD, EURUSD, GBPUSD).
Catatan: Pengaturan Awal: Untuk sebagian besar pasangan utama, pengaturan default sudah dioptimalkan. Jika Anda berdagang indeks yang volatil, Anda mungkin ingin meningkatkan Range Global ATR Mult menjadi 2.0
Penting: Membaca Dashboard
Dashboard di sudut kanan atas adalah pusat kendali Anda:
- Skor +2 (Hijau): Bullish Kuat. Hanya cari setup Beli.
- Skor -2 (Merah): Bearish Kuat. Hanya cari setup Jual.
- Skor 0 (Abu-abu): Netral. Pasar sedang bergerak sideways atau dalam transisi. Bersabarlah.
- Support/Resistance: Menunjukkan berapa banyak "lantai" dan "langit-langit" historis yang ada dalam tren saat ini.
Strategi Masuk 3 Langkah
Langkah 1: Identifikasi Bias Tunggu warna lilin dan skor Dashboard mencapai +2 atau -2. Ini mengonfirmasi bahwa pasar telah menembus struktur dan tren sedang dimulai.
Langkah 2: Area Nilai Jangan mengejar harga. Tunggu harga untuk menarik kembali (retracement) ke salah satu 3 garis terdekat yang digambar di grafik Anda.
- Dalam tren turun (Skor -2), tunggu harga menyentuh Garis Merah.
- Dalam tren naik (Skor +2), tunggu harga menyentuh Garis Hijau.
Langkah 3: Eksekusi Masuk ke perdagangan Anda saat harga menyentuh garis dan menunjukkan penolakan (terbentuk sumbu).
- Stop Loss: Tempatkan SL Anda tepat di belakang garis struktural.
- Take Profit: Targetkan garis struktural berikutnya sesuai arah tren.
Tips Profesional untuk Sukses
- Aturan Kerangka Waktu Lebih Tinggi: Skor +2 pada grafik H4 atau D1 jauh lebih kuat daripada skor pada grafik M5. Gunakan kerangka waktu lebih tinggi untuk menemukan bias, dan kerangka waktu lebih rendah untuk menemukan entri Anda.
- Grafik Bersih: Jika layar terasa ramai, buka pengaturan dan ubah
Max Levels to Showmenjadi 2. Ini akan menampilkan hanya "Lantai" dan "Langit-langit" yang paling penting. - Zona "Nol": Ketika skor adalah 0, pasar sedang "menghitung ulang." Ini adalah waktu terbaik untuk mengambil keuntungan dari perdagangan sebelumnya dan menunggu breakout baru.
Pemecahan Masalah
- Tidak Ada Garis yang Terlihat? Periksa apakah Anda memiliki cukup riwayat yang dimuat di grafik Anda. Indikator membutuhkan setidaknya 100-200 bar untuk menghitung ATR dan level Ayunan.
- Indikator Lag? Jika PC Anda lambat, kurangi pengaturan
Max Historical Linesmenjadi 200 untuk membersihkan memori lebih cepat.
Pertanyaan yang Sering Diajukan (FAQ)
T: Apakah indikator ini repaint?
J: Tidak. Level dan skor dihitung berdasarkan penutupan lilin yang dikonfirmasi. Setelah level ditembus atau skor berubah pada penutupan lilin, itu terkunci dalam riwayat.
T: Kerangka waktu mana yang terbaik?
J: Logikanya universal. Namun, sebagian besar trader profesional menggunakannya pada grafik H1, H4, atau Harian untuk mengidentifikasi "Struktur Institusional." Jika Anda scalping pada M1 atau M5, harapkan perubahan skor yang lebih sering.
T: Bisakah saya menggunakan ini dengan indikator lain?
J: Ya! Ini bekerja sempurna sebagai "Filter Arah." Misalnya, hanya ambil sinyal RSI oversold jika Skor Bias Tren adalah +2.
Selamat Berdagang!
Bukan Nasihat Keuangan. Indikator Trend Bias Structure adalah alat analisis teknikal yang dirancang untuk membantu trader mengidentifikasi struktur pasar dan bias tren.
Ringkasan
Key features include:
- Smart Structure Mapping: Automatically detects significant support and resistance levels filtered by ATR-based volatility.
- SGE Scoring Engine: Calculates trend strength by counting breached structural levels.
- Anti-Clutter Display: Shows only the three closest relevant levels to maintain chart clarity.
- Momentum Detection: Uses "Big Candle" logic to highlight moves with institutional backing.
- Customizable sensitivity for different assets such as XAUUSD, EURUSD, GBPUSD, and indices.
The indicator works on all timeframes from 1 minute to monthly, with professional traders typically using H1, H4, or daily charts to identify institutional structure. The dashboard provides a clear bias score and structural levels to guide trade entries and exits. Users are advised to trade with the bias, waiting for price pullbacks to the nearest structure lines before executing trades.
This tool is intended as a directional filter and can be combined with other indicators like RSI. It does not repaint, as calculations are based on confirmed candle closes.
Ulasan pelanggan
5 | 100 % | |
4 | 0 % | |
3 | 0 % | |
2 | 0 % | |
1 | 0 % |


