
Nassimi Take Profit
cBot
498 i̇ndirmeler
Sürüm 1.0, Jan 2025
Windows, Mac, Mobile, Web
5.0
Değerlendirmeler: 1
Açıklama
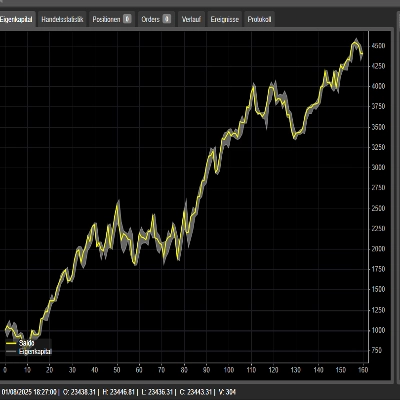
Bu dijital illüstrasyon, Nassimi Take Profit robotuna odaklanan bir ticaret grafiğini görselleştiriyor. Grafik, yukarı hareket için yeşil çubuklarla bir yükseliş yutan mum formasyonunu ve aşağı hareket için kırmızı çubuklarla bir düşüş yutan mum formasyonunu gösteriyor. Ticaret robotu, grafikler, çizgiler ve çeşitli finansal göstergelerle çevrili, şık ve geleceğe dönük otomatik bir sistem arayüzü ile simgelenmiştir. Ayrıca, görüntüde stop loss ve take profit seviyeleri gibi risk yönetiminin temel unsurları da yer almakta ve bunlar grafik üzerinde çizgiler olarak temsil edilmektedir. Genel stil modern, temiz ve teknoloji esintili olup, otomatik ticaretin profesyonel ve görsel olarak etkileyici bir temsilini yaratmaktadır.
Özet
YZ özeti
Nassimi Take Profit is an automated trading robot designed to operate on financial charts featuring bullish and bearish engulfing patterns. The system visually represents upward price movements with green bars and downward movements with red bars. It integrates key risk management tools, including stop loss and take profit levels, which are displayed as lines on the trading chart. The robot’s interface is modern and tech-inspired, incorporating various financial indicators and graphical elements to support automated trading decisions. This product focuses on visualizing and executing trades based on price action patterns within a clean, professional framework.
İşlem profili
Müşteri değerlendirmeleri
5.0
Değerlendirmeler: 1
5 | 100 % | |
4 | 0 % | |
3 | 0 % | |
2 | 0 % | |
1 | 0 % |
Müşteri değerlendirmeleri
November 20, 2025
Nassimi Take Profit is a clean utility tool for managing TP levels. It doesn’t open trades, so all test results stay at zero - which is expected. In live-mode it performs flawlessly: assigns TP, updates it, and handles multiple orders reliably. A solid add-on for manual traders, but not a strategy for ROI testing.
Tartışma
SSS
cTrader Store üzerinden erişilebilen işlem botları, göstergeler ve eklentiler gibi ürünler, üçüncü taraf sağlayıcılar tarafından sağlanır ve yalnızca bilgilendirme ve teknik erişim amaçlarıyla sunulur. cTrader Store bir broker değildir ve yatırım tavsiyesi, kişisel öneriler vermez veya gelecekteki performansı garanti etmez.
Bu oluşturanın diğer ürünleri


Fiyat
Başlangıç 14/01/2025
1.02K
Ücretsiz yüklemeler