present
Zarejestruj się i otrzymaj 50 $ zniżki na pierwszy zakup
44.34M
Wolumen transakcji
45.33K
Zysk w pipsach
3
Sprzedaż
1.63K
Bezpłatne instalacje

Opis

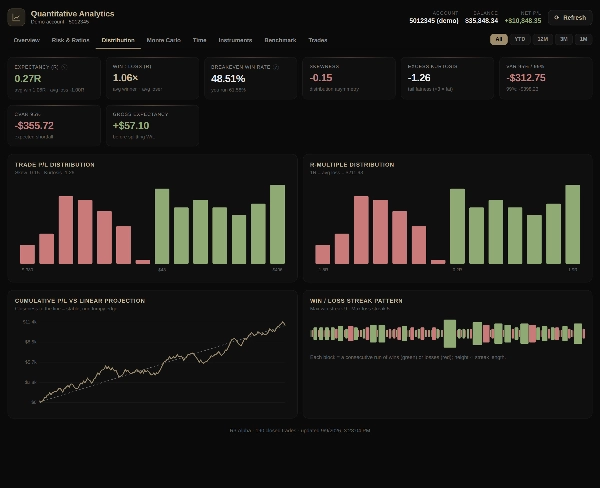
R3 Alpha Analytics zamienia historię Twoich transakcji w cTrader na raport o wydajności i ryzyku na poziomie instytucjonalnym — automatycznie, bez ręcznego wprowadzania danych. Odczytuje Twoje zamknięte transakcje i oblicza pełny zestaw wskaźników ilościowych w dziesięciu zakładkach:

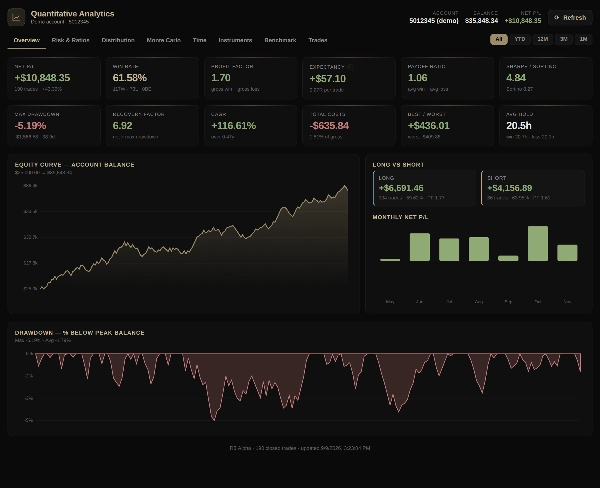
  • Przegląd — zysk/strata netto, całkowity procent zwrotu, średni miesięczny zwrot, wskaźnik wygranych, współczynnik zysku, oczekiwana wartość, CAGR, maksymalne obsunięcie kapitału, krzywa kapitału oraz podział na pozycje długie i krótkie.
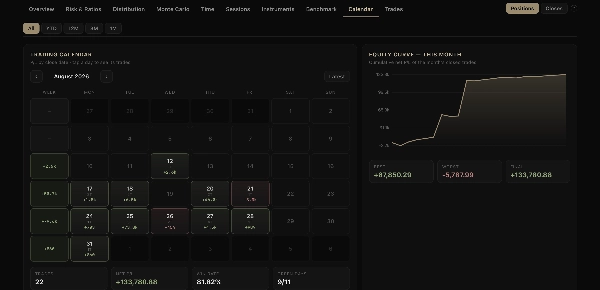
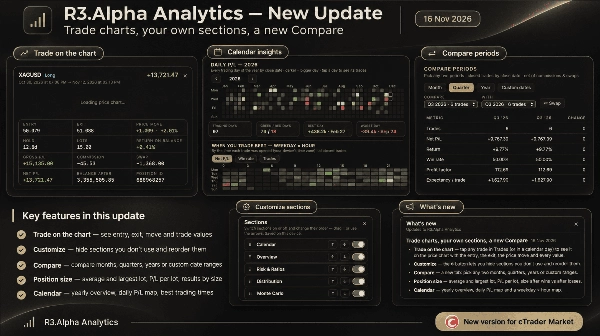
  • Kalendarz — dzienny kalendarz zysków/strat z sumami tygodniowymi, widokiem dnia otwieranym dotknięciem oraz przeglądem całego roku.
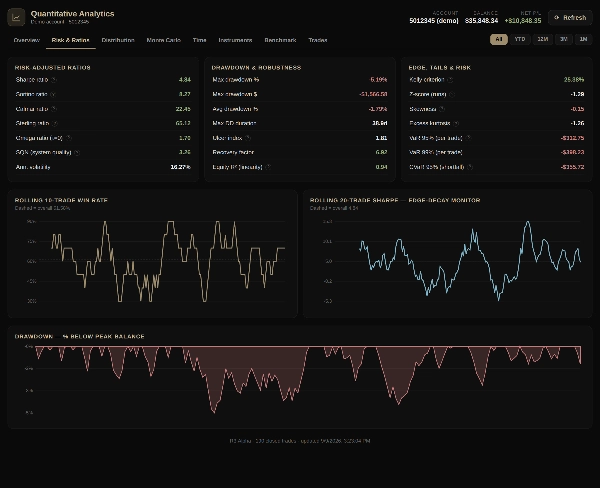
  • Ryzyko i wskaźniki — Sharpe, Sortino, Calmar, Sterling, Omega, SQN, VaR/CVaR, wskaźnik wrzodów, współczynnik odzysku, wskaźnik wygranych w ruchomym oknie oraz ruchomy Sharpe.
  • Rozkład — mnożniki R, skośność, kurtoza, histogram zysków/strat oraz serie wygranych/przegranych.
  • Monte Carlo — ryzyko bankructwa, prawdopodobieństwo zysku, symulowane obsunięcia kapitału oraz percentyle kapitału.
  • Czas — wydajność według dnia tygodnia, godziny, miesiąca oraz czasu trzymania pozycji.
  • Sesje — sesje azjatycka, londyńska, nakładanie się Londynu i Nowego Jorku oraz Nowy Jork porównane pod względem siły i jakości, z najlepszymi parami walutowymi w każdej sesji.
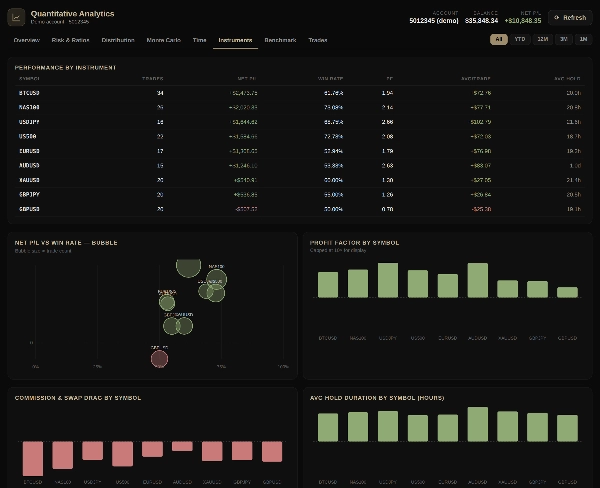
  • Instrumenty — wyniki, współczynnik zysku, koszty i czas trzymania dla każdego symbolu.
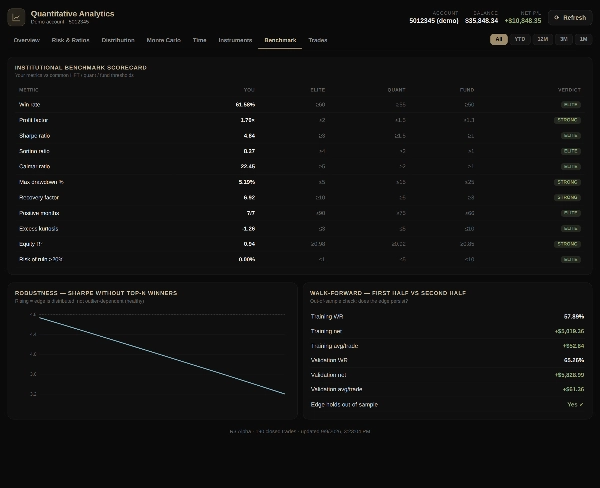
  • Benchmark — karta wyników względem progów HFT, quant i funduszy, z walidacją walk-forward.
  • Transakcje — pełny dziennik transakcji z cenami wejścia i wyjścia, czasem trzymania, swapami i prowizjami.

Każdy wykres jest interaktywny. Filtry okresów (Wszystkie, YTD, 12M, 3M, 1M) przeliczają każdy wskaźnik na granicach kalendarza, a przełącznik Pozycje / Zamknięcia pozwala liczyć każdą pozycję jako jedną transakcję lub dopasować statystyki cTrader, gdzie każde częściowe zamknięcie jest osobną transakcją. Wtyczka jest wyłącznie do odczytu i nigdy nie wykonuje transakcji. Używaj jej do audytu swojej przewagi, monitorowania obsunięć i spójności oraz dokładnego sprawdzania, jak działa Twój system.

Podsumowanie

Podsumowanie AI
R3.Alpha Analytics is a web plugin designed for cTrader accounts that automatically generates institutional-grade performance and risk reports from your closed trade history. It provides a comprehensive quantitative analysis across eight interactive tabs, including:

1. Overview: net profit/loss, win rate, profit factor, expectancy, CAGR, and drawdown.
2. Risk & Ratios: metrics such as Sharpe, Sortino, Calmar, Sterling, Omega, SQN, VaR/CVaR, Ulcer index, and recovery factor.
3. Distribution: analysis of R-multiples, skewness, kurtosis, and profit/loss histograms.
4. Monte Carlo simulations: risk of ruin, probability of profit, and equity percentiles.
5. Time and instrument breakdowns.
6. Benchmark scorecard: compares performance against high-frequency trading, quantitative, and fund thresholds with walk-forward validation.
7. Full trade log.

All charts are interactive with period filters that dynamically update metrics. The plugin operates in read-only mode and does not place trades. It is intended for auditing trading edge, monitoring drawdowns and consistency, and detailed system performance evaluation.
Profil wtyczki
Kategoria wtyczki
Analityka
Dostęp do danych
Pozycje
Historia
Zlecenia
Konta

Dyskusja

Opinie klientów

4.9
Opinie: 42
5
98 %
4
2 %
3
0 %
2
0 %
1
0 %
Opinie klientów
November 17, 2026
November 17, 2026
All what I needed in one plugin. Very good idea
November 16, 2026
Turns out my favorite trading pair isn’t actually my most profitable one. That was unexpected! The statistics for each currency pair are also incredibly well designed. I haven’t seen anything like this anywhere else, not even in the paid trading journals I’ve tried. Highly recommend it. Thanks!
November 13, 2026
I figured it out pretty quickly. Now I review my trading statistics after every trading week
November 11, 2026
very good plugin!
November 9, 2026
November 5, 2026
November 5, 2026
October 29, 2026
October 29, 2026
this plugin saved me $1300/year I no longer have to spend on other services to get this kind of data, thanks!
October 27, 2026
nice
October 27, 2026
October 26, 2026
October 22, 2026
Excellent solution! My entire community will be using it
October 22, 2026
October 19, 2026
R3.Alpha Analytics presents detailed trading statistics, risk metrics, costs and performance charts in a polished dashboard. The 844-trade Overview shows consistent trade counts, win rate and Long/Short totals. The detachable window is particularly effective. In the narrow Symbol Tab, tooltip overlap and multi-line navigation slightly reduce usability. Score: 4.7/5.
October 14, 2026
October 14, 2026
A good thing for those who want to approach trading a little more systematically, Overall, everything is simple and clear, I liked it, especially for the weekly debriefing
October 14, 2026
October 14, 2026
I don't usually write reviews, but this is really more convenient than my old analysis method, and requires much less manual work
October 12, 2026
October 11, 2026
the Positions / Closes switch keeps partial exits from muddling the statistics, with 10 analytics tabs and 1M, 3M and 12M views giving returns, R multiples and drawdown a properly detailed account review.
October 10, 2026
October 7, 2026
October 7, 2026
thanks for data
October 7, 2026
October 7, 2026
October 6, 2026
October 6, 2026
October 6, 2026
After analyzing my results, I realized that my problem isn’t the win rate, but the size of my losing trades, very useful
October 6, 2026
Top tools!
October 2, 2026
Comparing complete positions with individual closes gives the account statistics some useful context. The 1M, 3M and 12M windows sit alongside R multiples and drawdown rather than leaving the review at a plain profit total.
September 30, 2026
September 30, 2026
I like that the statistics here don't just look like a bunch of numbers. This one can actually be used to analyze trading
September 28, 2026
September 28, 2026
September 25, 2026
I've used several similar tools I particularly liked the detailed trading history
September 25, 2026
After connecting, I immediately discovered several things in my trading that I hadn't noticed before, thank you
September 21, 2026
September 21, 2026
Very good, please add more analysis by trading sessions
September 21, 2026
Finally, someone has created a worthwhile product! Super useful, thanks.
September 21, 2026
Top analytic dashboard

Częste pytania

Risk/Reward
Risk/Reward
Trade Journal
Trade Statistics
Produkty dostępne za pośrednictwem cTrader Store, w tym boty handlowe, wskaźniki i wtyczki, dostarczane są przez deweloperów zewnętrznych i udostępniane wyłącznie w celach informacyjnych oraz w celu zapewnienia dostępu technicznego. cTrader Store nie jest brokerem i nie zapewnia doradztwa inwestycyjnego, nie udziela spersonalizowanych rekomendacji ani nie gwarantuje przyszłych wyników.

Cena