Açıklama
Forex Trend Takip Stratejisi Açıklaması (İngilizce)
Bu trend takip stratejisi, güçlü piyasa trendlerini belirlemek için Üssel Hareketli Ortalamalar (EMA), MACD ve ADX kullanır. Momentum ve trend gücüne dayalı alış ve satış sinyalleri üretir.
Nasıl Çalışır
1️⃣ Trend Yönünü Belirleme
- Hızlı EMA (21) ve Yavaş EMA (50) genel trend yönünü belirler:
-
- Boğa Trendi → Hızlı EMA, Yavaş EMA'nın üzerindedir
- Ayı Trendi → Hızlı EMA, Yavaş EMA'nın altındadır
2️⃣ Trend Momentumunu Ölçme (MACD Histogramı)
- MACD histogramı momentumu doğrular:
-
- Boğa Momentumu → MACD histogramı sıfırın üzerindedir
- Ayı Momentumu → MACD histogramı sıfırın altındadır
3️⃣ Trend Gücünü Kontrol Etme (ADX Göstergesi)
- ADX (14) trend gücünü ölçer:
-
- Güçlü Trend → ADX 25 üzerinde
- Zayıf Trend → ADX 25 altında (sinyal yok)
İşlem Yürütme
✅ Alış Sinyali (Boğa Girişi)
- Hızlı EMA > Yavaş EMA (Yükseliş Trendi)
- MACD Histogramı > 0 (Momentum doğrulaması)
- ADX > 25 (Güçlü trend)
- 🔹 Alış oku düşük fiyatın altında belirir
❌ Satış Sinyali (Ayı Girişi)
- Hızlı EMA < Yavaş EMA (Düşüş Trendi)
- MACD Histogramı < 0 (Momentum doğrulaması)
- ADX > 25 (Güçlü trend)
- 🔻 Satış oku yüksek fiyatın üzerinde belirir
Ana Özellikler
✔ ADX kullanarak zayıf trendlerden kaçınır
✔ MACD doğrulaması ile yanlış sinyalleri filtreler
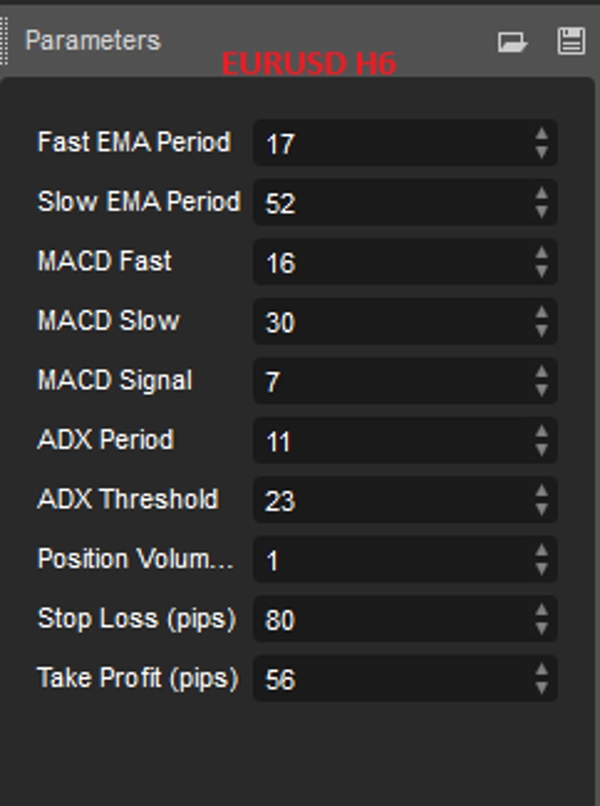
✔ Daha iyi özelleştirme için ayarlanabilir parametreler
Bu gösterge, traderların güçlü trendleri takip etmelerine ve zayıf piyasa koşullarından kaçınmalarına yardımcı olur. 🚀
Özet
Key components of the strategy include:
- Trend Direction: Determined by the relationship between a fast EMA (21) and a slow EMA (50). A bullish trend is indicated when the fast EMA is above the slow EMA; a bearish trend when it is below.
- Momentum Confirmation: The MACD histogram confirms momentum, with positive values indicating bullish momentum and negative values indicating bearish momentum.
- Trend Strength: The ADX (14) measures trend strength, with values above 25 signaling a strong trend suitable for trading; values below 25 indicate weak trends where no signals are generated.
Trade execution signals:
- Buy signals occur when the fast EMA is above the slow EMA, MACD histogram is positive, and ADX is above 25. A buy arrow appears below the low price.
- Sell signals occur when the fast EMA is below the slow EMA, MACD histogram is negative, and ADX is above 25. A sell arrow appears above the high price.
The bot features adjustable parameters for customization and aims to avoid weak trends and filter false signals, helping traders focus on strong market movements.
Tartışma
Müşteri değerlendirmeleri
5 | 0 % | |
4 | 100 % | |
3 | 0 % | |
2 | 0 % | |
1 | 0 % |