Beschreibung
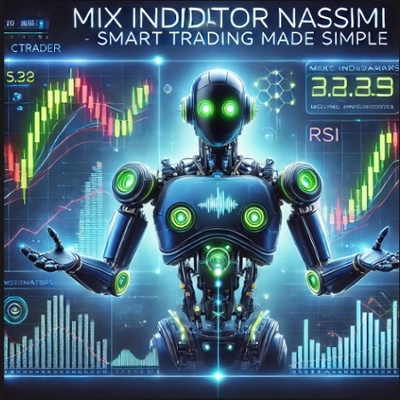
Diese digitale Illustration visualisiert ein Handelsdiagramm mit Fokus auf den Nassimi Take Profit Roboter. Das Diagramm zeigt ein bullisches Engulfing-Muster mit grünen Balken für Aufwärtsbewegungen und ein bärisches Engulfing-Muster mit roten Balken für Abwärtsbewegungen. Der Handelsroboter wird durch eine schlanke, futuristische automatisierte Systemoberfläche symbolisiert, umgeben von Grafiken, Linien und verschiedenen Finanzindikatoren. Zusätzlich enthält das Bild Schlüsselelemente des Risikomanagements, wie Stop-Loss- und Take-Profit-Niveaus, die als Linien im Diagramm dargestellt sind. Der Gesamtstil ist modern, sauber und technologieinspiriert und schafft eine professionelle und visuell ansprechende Darstellung des automatisierten Handels.
Zusammenfassung
Kundenbewertungen
5 | 100 % | |
4 | 0 % | |
3 | 0 % | |
2 | 0 % | |
1 | 0 % |