Beschreibung
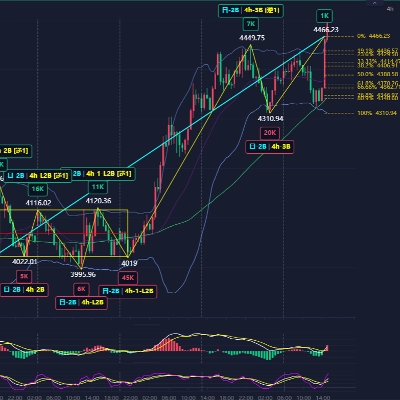
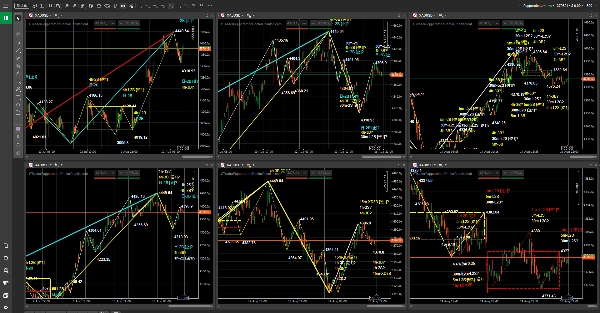
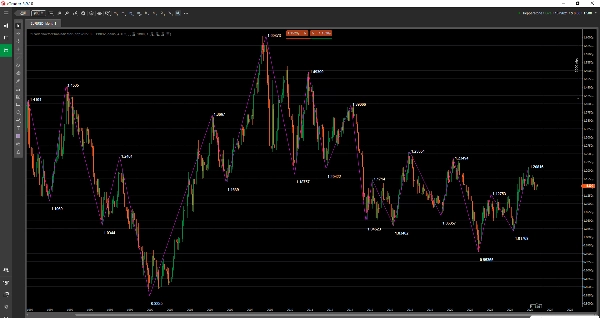
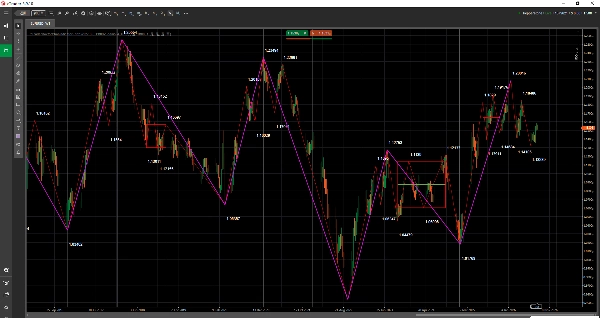
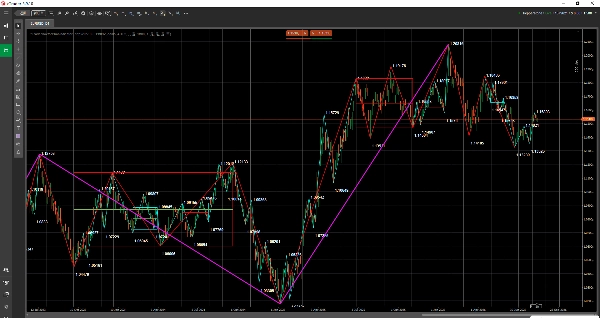
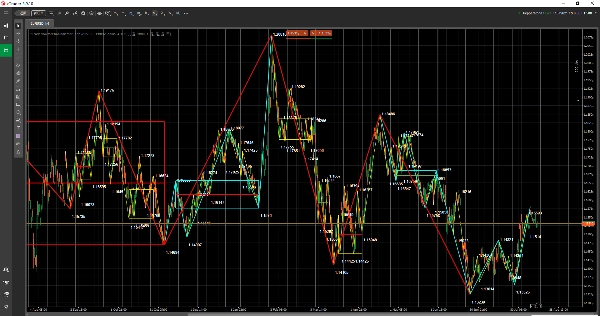
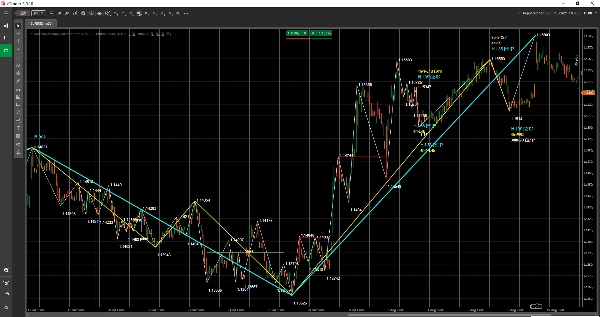
Der Dr. Chanlun Strukturindikator für cTrader ist ein Marktstruktur- / Chart-Overlay-Technikanalyseindikator, der verwendet wird, um Chanlun-Strukturen auf cTrader-Charts anzuzeigen.
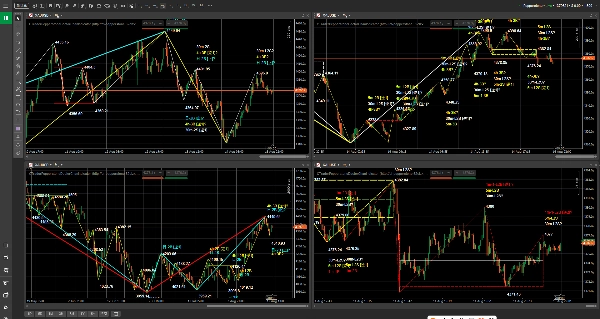
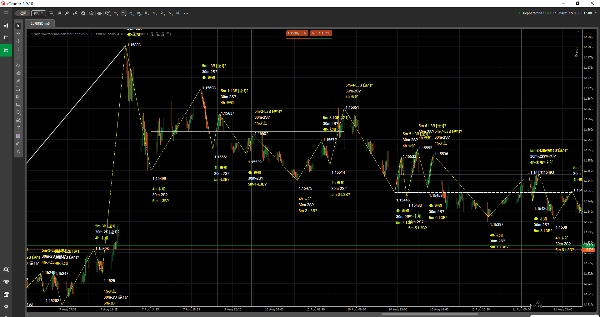
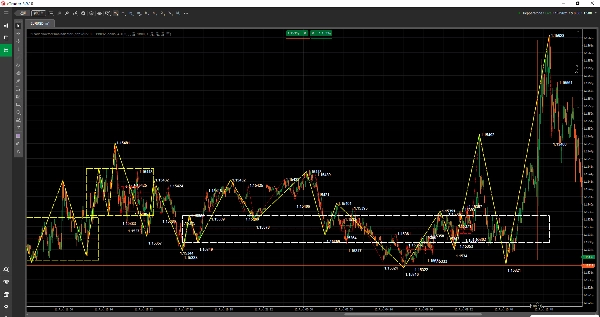
Er eignet sich für Trader, die sich auf Preisbewegungen, Trendstrukturen und Multi-Timeframe-Analysen konzentrieren. Der Indikator zeigt wichtige Chanlun-Strukturen als Chart-Objekte an, darunter Bi-Strukturen, Zhongshu-Zonen, Kauf-/Verkaufsmarkierungen und mehr, und hilft den Nutzern, den Marktrhythmus, strukturelle Veränderungen und Beziehungen zwischen verschiedenen Zeitrahmen intuitiver zu beobachten.
Dieser Indikator ist kein automatisierter Handelsroboter und kein Handelssignal-Service. Sein Zweck ist es, den Nutzern zu helfen, Charts besser zu lesen, Märkte zu überprüfen und Handelspläne klarer zu erstellen.
Die aktuelle Version ist kompatibel mit bestimmten Pepperstone cTrader-Symbolen und Zeitrahmen. Dieses Produkt ist ein unabhängiger Drittanbieter-Indikator und kein offizielles Pepperstone-Produkt oder Pepperstone-Partnerprodukt.
Indikatorübersicht
- Indikatortyp: Marktstruktur- / Chart-Overlay-Indikator.
- Bevorzugte Instrumente: bestimmte Forex-, Indizes-, Rohstoff-, Kryptowährungs- und Aktien-CFD-Symbole in Pepperstone cTrader.
- Bevorzugte Zeitrahmen: 1 Minute, 5 Minuten, 15 Minuten, 30 Minuten, 1 Stunde, 4 Stunden, täglich, wöchentlich und monatlich.
- Handelsanwendungsfall: Beobachtung der Chartstruktur, Multi-Timeframe-Analyse, Unterstützung bei der Vorbereitung und Überprüfung von Handelsplänen.
Was Sie im Chart sehen können
- Bi-Strukturen: zur Beobachtung des Schwungrhythmus und der strukturellen Entwicklung.
- Zhongshu-Zonen: zur Beobachtung wichtiger Konsolidierungs-, Gleichgewichts- und struktureller Überlappungsbereiche.
- Kauf-/Verkaufsmarkierungen: zur Unterstützung bei der Lokalisierung wichtiger struktureller Bezugspunkte.
- Textbeschriftungen, horizontale Linien, vertikale Linien, rechteckige Bereiche, Trendlinien und andere Chart-Objekte.
- Automatische Datenanpassung an den aktuellen Chart-Zeitrahmen wird standardmäßig unterstützt, was die Multi-Timeframe-Beobachtung erleichtert.
Für wen dieser Indikator gedacht ist
- Nutzer, die Dr. Chanlun Strukturindikator und Chanlun-Strukturanalyse erlernen oder verwenden.
- Nutzer, die Strukturinformationen direkt auf cTrader-Charts anzeigen möchten.
- Nutzer, die Pepperstone zur Ansicht von Forex, Indizes, Rohstoffen, Kryptowährungen oder Aktien-CFDs verwenden.
- Trader, die Trendstrukturen über verschiedene Zeitrahmen hinweg vergleichen müssen.
- Nutzer, die Chart-Lese-, Planungs- und Überprüfungsabläufe klarer gestalten möchten.
Zugang und Lizenzierung
Produktzugang und Lizenzierung werden über den Kauf-, Test- und Installationsprozess im cTrader Store verwaltet. Bitte beachten Sie den Kaufstatus, Teststatus und die Produktinformationen auf der Produktseite im cTrader Store.
Derzeit unterstützte Pepperstone-Symbole
Forex:
GBPUSD, EURUSD, USDJPY, USDCHF, AUDUSD, USDCAD, GBPJPY
Indizes:
US500, NAS100, GER40, UK100, JPN225, VIX, HSTECH
Rohstoffe:
XAUUSD, XAGUSD
Kryptowährungen:
BTCUSD, ETHUSD
Aktien:
AAPL.US-24, MSFT.US-24, GOOG.US-24, AMZN.US-24, TSLA.US-24, NVDA.US-24, META.US-24, NFLX.US-24, JPM.US-24
Unterstützte Zeitrahmen
1 Minute, 5 Minuten, 15 Minuten, 30 Minuten, 1 Stunde, 4 Stunden, täglich, wöchentlich und monatlich.
Vorgeschlagener Arbeitsablauf
1. Öffnen Sie ein Chart für ein unterstütztes Symbol in der Pepperstone cTrader-Umgebung.
2. Laden Sie den Dr. Chanlun Strukturindikator auf das Chart.
3. Die Datenzeit des Dr. Chanlun Strukturindikators ist UTC+0. Stellen Sie beim Überprüfen der Chartstrukturen sicher, dass Sie die cTrader-Chart-Zeitzone vor dem Positionsvergleich auf die entsprechende Zeitzone umstellen.
4. Stellen Sie sicher, dass der aktuelle Chart-Zeitrahmen unterstützt wird. Der Indikator passt die Daten automatisch an den Chart-Zeitrahmen an.
5. Schalten Sie "Show Bi", "Show Zhongshu" und "Show Buy/Sell" nach Bedarf ein oder aus.
6. Beobachten Sie die Chartstruktur zusammen mit Ihrem eigenen Handelsplan, Positionsmanagement und Risikokontrolle.
Parametereinstellungen
Die aktuelle Version zeigt im cTrader-Indikatorpanel nur die folgenden 3 sichtbaren Parameter an. Datenzeitrahmen, Broker-Symbolsuffix, Cache, Aktualisierung, komprimierte Übertragung und Protokollierungseinstellungen werden intern vom Indikator verwaltet und müssen für die normale Nutzung nicht konfiguriert werden.
Show Bi
Standardwert: "true"
Ob Bi-Strukturen angezeigt werden sollen.
Show Zhongshu
Standardwert: "true"
Ob Zhongshu-Zonen angezeigt werden sollen.
Show Buy/Sell
Standardwert: "true"
Ob Kauf-/Verkaufsmarkierungen angezeigt werden sollen.
Wichtige Hinweise
- Dieses Produkt ist ein technischer Analyseassistent und kein automatisierter Handelsroboter.
- Der Indikator platziert keine Aufträge automatisch.
- Der Indikator stellt keine Anlageberatung, keinen Handelssignal-Service und keine Gewinngarantie dar.
- Die aktuelle Version ist nur mit bestimmten Pepperstone cTrader-Symbolen und bestimmten Zeitrahmen kompatibel.
- Die Datenzeit des Dr. Chanlun Strukturindikators ist UTC+0. Bitte wechseln Sie beim Anzeigen auf einem cTrader-Chart vor der Überprüfung der Strukturpositionen in die entsprechende Chart-Zeitzone.
- Nutzer sollten ihn zusammen mit ihrem eigenen Handelsplan, Positionsmanagement, Risikokontrolle und unabhängiger Beurteilung verwenden.
Zukünftige Update-Richtung
Die aktuelle Release-Version priorisiert bestimmte Pepperstone cTrader-Symbole und Zeitrahmen. Zukünftige Updates können gemäß dem Produktplan weitere Broker, weitere Symbolzuordnungen und einen umfassenderen Datenservicebereich erweitern.
Risikohinweis
Der Handel an den Finanzmärkten ist mit Risiken verbunden. Vergangene Leistungen garantieren keine zukünftigen Ergebnisse. Dieser Indikator ist nur ein technisches Analyse- und Lernhilfsmittel. Er stellt keine Anlageberatung, keinen Handelssignal-Service und keine Gewinngarantie dar. Historische Strukturen repräsentieren keine zukünftigen Ergebnisse. Nutzer sollten ihn in ihrer eigenen Handelsumgebung umfassend testen und vorsichtig zusammen mit Risikomanagementregeln verwenden.
Zusammenfassung
This tool is intended for traders focusing on price action, trend structure, and multi-timeframe analysis. It supports automatic data matching to the current chart timeframe, facilitating easier multi-timeframe observation. Users can toggle the display of Bi structures, Zhongshu zones, and buy/sell markers according to their preferences.
Dr. Chanlun Structure is a technical analysis assistant and does not provide automated trading or trading signals. It requires users to apply their own trading plans, risk management, and judgment. The indicator is compatible with specified Pepperstone cTrader symbols and timeframes and uses UTC+0 data time, requiring appropriate chart timezone settings for accurate structure alignment.