Descripción
Análisis de Comercio
Comprenda la calidad de su ventaja comercial con un panel de análisis compacto centrado en la expectativa, la robustez y la estructura del rendimiento.
Análisis de Comercio es un potente complemento de análisis creado para traders que desean más que solo cifras de ganancias y pérdidas. En lugar de mostrar solo lo que su trading generó, le ayuda a entender cómo se están produciendo sus resultados y si su ventaja parece fuerte, equilibrada y confiable.
El complemento se enfoca en la calidad estadística de su trading destacando la expectativa, la estructura de pago, la concentración de ganancias, la fuerza de recuperación, la consistencia y el comportamiento del tiempo de retención en un panel limpio construido directamente dentro de cTrader.
Características clave
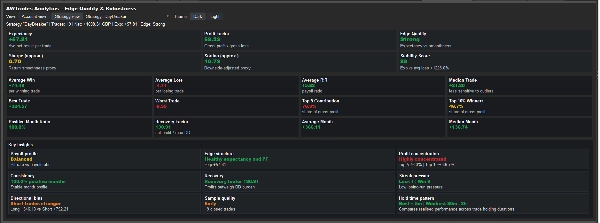
Panel de calidad de la ventaja
Evalúe rápidamente la calidad general de su enfoque comercial con métricas claras principales, incluyendo:
• Expectativa
• Factor de Ganancia
• Sharpe (aprox.)
• Sortino (aprox.)
• Puntuación de Estabilidad
• Calificación de Calidad de la Ventaja
Esto le brinda una vista rápida de si sus resultados comerciales parecen robustos, fluidos o frágiles.
Análisis de la estructura de pago
Comprenda cómo se construye su ventaja revisando:
• Ganancia promedio
• Pérdida promedio
• Perfil promedio de recompensa-riesgo
• Operación mediana
• Mejor operación
• Peor operación
Esto le ayuda a ver si su estrategia depende más de la tasa de aciertos, el pago o una combinación de ambos.
Panel de ideas clave
Análisis de Comercio transforma estadísticas en bruto en un conjunto más legible de conclusiones, destacando áreas como:
• Perfil de pago
• Estructura de la ventaja
• Concentración de ganancias
• Consistencia
• Fuerza de recuperación
• Presión de rachas
• Sesgo direccional
• Calidad de la muestra
• Patrón de tiempo de retención
Esto hace que el panel sea más fácil de interpretar de un vistazo.
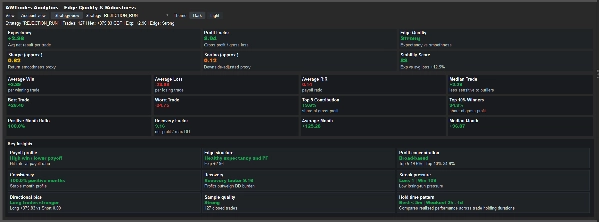
Concentración de ganancias y robustez
Vea si sus resultados están ampliamente distribuidos o dependen en gran medida de un pequeño número de operaciones.
Incluye:
• Contribución de los 5 principales
• Contribución del 10% superior de ganadores
• Factor de recuperación
• Ratio de meses positivos
• Puntuación de estabilidad
Esto ayuda a identificar si el rendimiento parece sostenible o excesivamente dependiente de valores atípicos.
Perspectiva del patrón de tiempo de retención
Análisis de Comercio compara el rendimiento realizado a través de diferentes duraciones de retención de operaciones para mostrar dónde su ventaja ha sido más fuerte o más débil.
Esto no asume que retenciones más cortas o más largas son inherentemente mejores. En cambio, muestra lo que realmente ha funcionado mejor en la muestra seleccionada.
Vistas de cuenta y estrategia
Analice todo el historial de su cuenta o concéntrese solo en estrategias etiquetadas.
Use:
• Vista de cuenta
• Vista de estrategia
• Selector de estrategia
• Temas oscuro y claro
Esto facilita revisar tanto el rendimiento general como los sistemas individuales.
Diseñado para traders que desean una visión más profunda del rendimiento
Análisis de Comercio es ideal para traders que quieren entender no solo qué ocurrió, sino qué tan fuerte y confiable es realmente su ventaja comercial.
Es útil para:
• Traders manuales que revisan la calidad de su ejecución
• Traders de sistemas que analizan la fuerza de una estrategia
• Proveedores de señales que evalúan la robustez y consistencia
• Traders que comparan diferentes estrategias etiquetadas dentro de una cuenta
Combina perfectamente con otras herramientas de AWTrades:
Análisis de Comercio está diseñado para complementar el conjunto más amplio de herramientas de AWTrades:
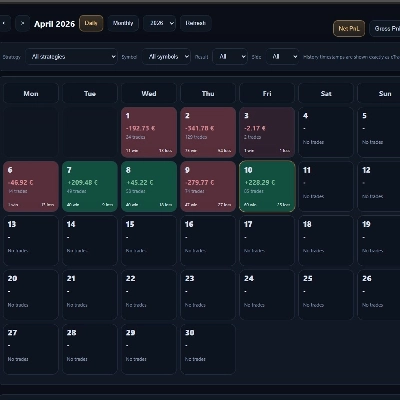
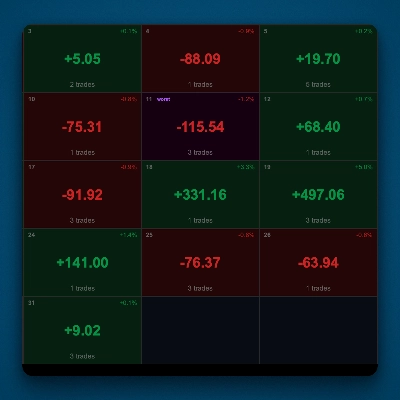
• PnL Studio – para revisión visual del rendimiento, desglose diario y análisis basado en calendario
• Risk Watch – para monitoreo en vivo de exposición, riesgo abierto y riesgo en el peor de los casos
Juntos, los tres complementos proporcionan un flujo de trabajo comercial más completo:
- PnL Studio = revisión visual del rendimiento
- Risk Watch = monitoreo de riesgo en vivo
- Análisis de Comercio = análisis de calidad y robustez de la ventaja
Limpio, ligero y fácil de usar
El complemento se ejecuta directamente dentro de cTrader y no requiere software externo.
Simplemente abra la pestaña Análisis de Comercio para revisar instantáneamente la calidad estadística, la estructura y la robustez del rendimiento de su trading.
Resumen
The plugin analyzes payoff structure by presenting average wins and losses, reward-to-risk profiles, median, best, and worst trades, helping users understand whether their strategy relies more on hit rate or payoff. A key insights panel translates raw data into readable conclusions covering payoff profile, edge structure, profit concentration, consistency, recovery strength, streak pressure, directional bias, sample quality, and holding time patterns.
Trade Analytics also evaluates profit concentration and robustness by showing contributions from top trades, recovery factors, positive month ratios, and stability scoring to identify performance sustainability. It compares realized performance across different trade holding durations without bias toward any specific timeframe.
Users can analyze either their full account history or individual labeled strategies, with options for account or strategy views and theme customization. The plugin complements other AWTrades tools like PnL Studio and Risk Watch, forming a comprehensive trading analysis workflow. It runs directly inside cTrader without requiring external software.