Açıklama
Akıllı macd faz detektörü/tahmin modelleri Sistemi
🇫🇮
⭐ MACD FAZ TAKİPÇİSİ GELİŞTİRİLMİŞ™
Volatiliteye Uyumlu. Tahmine Dayalı. Faz Bilinçli Piyasa İstihbaratı.
Profesyonel Ürün
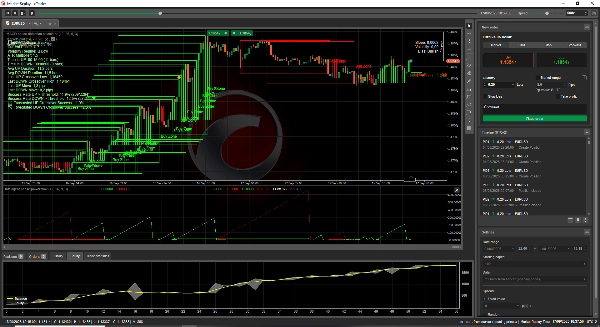
MACD Faz Takipçisi Geliştirilmiş™, basit sinyallerden fazlasını talep eden tüccarlar için tasarlanmış ileri teknoloji bir piyasa istihbarat sistemidir. Bu bir MACD kesişim göstergesi değildir — piyasa fazlarını cerrahi hassasiyetle takip eden, ölçen, tahmin eden ve görselleştiren tam ölçekli bir analiz motorudur.
Gelişmiş volatilite modellemesi, dinamik ATR eşikleri, rejime özgü olasılık takibi ve gerçek zamanlı faz tahmini üzerine inşa edilmiştir; bu araç size genellikle kurumsal analiz platformlarına ayrılan bir içgörü seviyesi sunar.
Piyasada sadece ne olduğunu değil — istatistiksel olarak bir sonraki ne yapacağını anlamak istiyorsanız…
bu sizin yeni rekabet avantajınızdır.
🎯 Temel Yetenekler
Akıllı MACD Faz Tespiti
Bu Sistem şunları tanımlar ve takip eder:
YUKARI Fazlar
AŞAĞI Fazlar
DÜZ / Geçiş Durumları
Her faz başladığı andan itibaren izlenir, şunlarla:
Süre takibi
Faz içi zaman sayacı
Gerçek zamanlı eğim ve volatilite bağlamı
ATR × volatiliteye dayalı dinamik eşikler
Bu size ekranın sol tarafında hızlı görünüm modunda mevcut piyasa ortamının tam bir resmini verir
Volatiliteye Uyumlu Eşik
ATR ve Standart Sapma kullanarak, gösterge beklentilerini otomatik olarak ayarlar:
Düşük Volatilite > Sıkı eşikler
Orta Volatilite > Orta dereceli eşikler
Yüksek Volatilite > Geniş eşikler
Bu, piyasa koşullarından bağımsız olarak faz başarısının adil bir şekilde ölçülmesini sağlar.
Hareket Takibi ve Başarı Olasılığı Modelleme
Her YUKARI ve AŞAĞI hareket kaydedilir ve analiz edilir:
Başarı ve başarısızlık
Ortalama hareket büyüklüğü
Ortalama süre
Volatiliteye özgü başarı oranları
Tarihsel kesişim performansı
Bunun ardından piyasanızın davranışının istatistiksel parmak izi elinizde olur...
Gerçek Zamanlı Tahmin
Tahmin Edilen YUKARI hareket Başarı Olasılığı
Tahmin Edilen AŞAĞI hareket Başarı Olasılığı
Bunlara (ama bunlarla sınırlı olmamak üzere) dayalı örnek:
Mevcut volatilite
Tarihsel performans
Hareket istatistikleri
Dinamik eşikler ve gerçek zamanlı hesaplanan birçok değer (hayır! şu anda birçok başka göstergede kullanılan değerler değil)
Bu, doğrudan grafiğinize entegre edilmiş öngörücü analizdir.
Görsel Geri Bildirim Sistemi
Grafiğiniz taktik bir komuta merkezine dönüşür:
Tam istatistiklerle faz kontrol paneli
Sonraki YUKARI ve AŞAĞI fazlar için dinamik hedef çizgileri
Şu anda kimin hakim olduğunu gösteren yanıp sönen kontrol noktası
🟢 Boğalar kontrol altında
🔴 Ayılar kontrol altında
🟡 Mücadele kararsız
Hareketler istatistiksel öneme ulaştığında uyarı simgeleri
Renk kodlu volatilite rejimi etiketleri
Her şey anında okunabilir ve görsel olarak sezgisel olacak şekilde tasarlanmıştır.
Neden Bu Çalışıyor
Piyasa fazlarını eşi görülmemiş bir netlikle anlayın
Duygular değil, istatistiksel güvenle işlem yapın
Bir kesişimin başarılı olma olasılığını önceden bilin
Volatiliteye uyarlanmış eşikleri gerçek zamanlı görün
Hareket kalitesi, süresi ve olasılığını takip edin
Boğalar veya ayılar ne zaman kontrolü ele alır bilin
Önemli anlarda etkili uyarılar alın
Bu, grafiğinizi karar verme makinesine dönüştüren türden bir araçtır.
Bu Gösterge Kimler İçin....
MACD'ye güvenen ama daha derin istihbarat isteyen tüccarlar
Deterministik, veri odaklı mantık gerektiren algoritmik tüccarlar
Faz bilincine sahip girişler isteyen swing ve günlük içi tüccarlar
Uyarlanabilir eşiklere ihtiyaç duyan volatiliteye duyarlı tüccarlar
Piyasa davranışını istatistiksel destekle tahmin etmek isteyen herkes
Nerede Çalışıyor?
Tüm zaman dilimlerinde çalışır
Tüm varlıklarda çalışır
Akıllı tespit piyasa koşullarına uyum sağlar
Notlar
Bu sistemin bir parçasıdır, tam performans için tüm 3 parçaya ihtiyacınız vardır
Ek 4. parça da edinilebilir; burada fiyat hareketine dayalı gelişmiş destek ve direnç seviyeleri elde edersiniz
Talimatlar satın alma sonrası gönderilir, tüm satın alımlar
Tüm satın alımlar Discord sunucusuna katılma hakkı verir.
Finlandiya yapımı 🇫🇮
⭐ MACD FAZ TAKİPÇİSİ GELİŞTİRİLMİŞ™
Fazı bilin. Hareketi ölçün. Geleceği tahmin edin.