Deskripsi
FedPulse - Plugin Analisis Kebijakan Fed untuk cTrader
═══════════════════════════════════════════════════
Tipe: Plugin Desktop | Platform: cTrader | Hak Akses: Tidak Ada
APA ITU FEDPULSE?
─────────────────
Berhenti berpindah antara CME FedWatch, situs Treasury, dan halaman ETF.
FedPulse menghadirkan semua yang Anda butuhkan untuk analisis kebijakan Fed dan logam mulia
ke dalam satu panel cTrader terpadu.
✓ Ekspektasi suku bunga CME FedWatch waktu nyata
✓ Pemantauan DXY dan kurva hasil Treasury
✓ Pelacakan kepemilikan ETF (GLD, IAU, SLV)
✓ Data inventaris gudang COMEX
✓ Rasio Emas/Perak dengan analisis statistik
Dibuat untuk trader logam dan FX yang ingin tetap unggul dalam pergeseran kebijakan Fed
tanpa meninggalkan platform trading mereka.
→ Coba uji coba gratis 7 hari untuk menjelajahi semua fitur.
SIAPA YANG HARUS MENGGUNAKAN FEDPULSE?
────────────────────────
• Trader Emas/Perak yang memantau fundamental makro
• Trader FX yang melacak arah kebijakan USD
• Trader swing yang mengatur waktu masuk sekitar acara FOMC
• Trader posisi yang menganalisis data sisi pasokan
• Siapa saja yang rutin memeriksa CME FedWatch
MODUL PANEL
─────────────
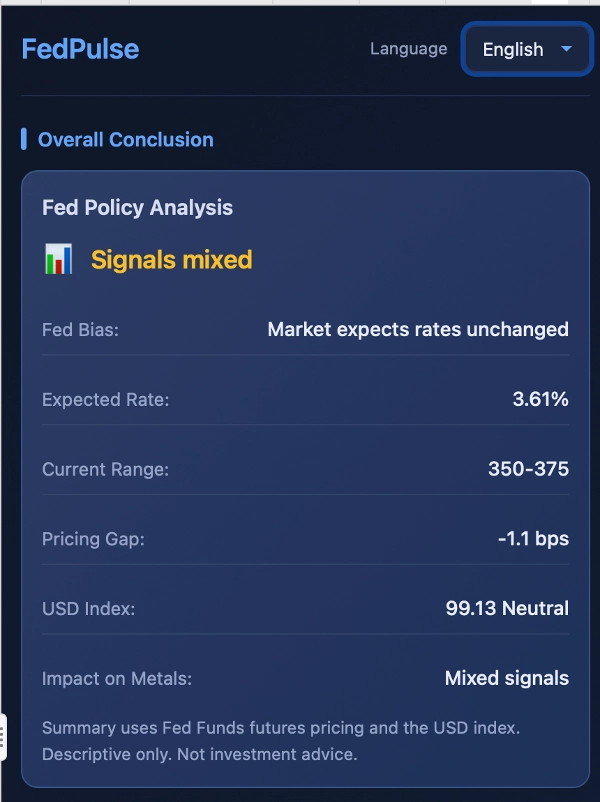
1. Kesimpulan Keseluruhan
Dasbor ringkas yang menunjukkan sikap kebijakan Fed utama secara sekilas.
Menampilkan: Bias Fed, Suku Bunga yang Diharapkan, Rentang Saat Ini, Celah Harga, DXY,
Dampak pada Logam
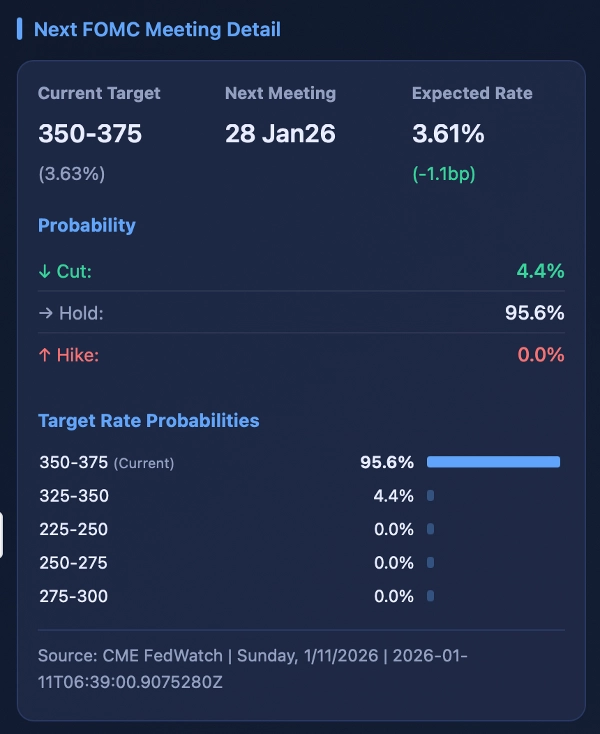
2. CME FedWatch - Pertemuan FOMC Berikutnya
Sumber Data: CME FedWatch
Pasar futures Fed Funds memproyeksikan probabilitas perubahan suku bunga untuk
pertemuan FOMC berikutnya — indikator kebijakan moneter USD yang paling maju.
• Hawkish: Diharapkan > Saat Ini + 2.5bps → Kekuatan USD, hambatan Au
• Dovish: Diharapkan < Saat Ini - 2.5bps → Kelemahan USD, dorongan Au
• Netral: Dalam ±2.5 bps → Tidak ada bias arah yang jelas
Menampilkan: Target Saat Ini, Pertemuan Berikutnya, Suku Bunga yang Diharapkan,
Probabilitas (Cut/Hold/Hike), Distribusi Suku Bunga
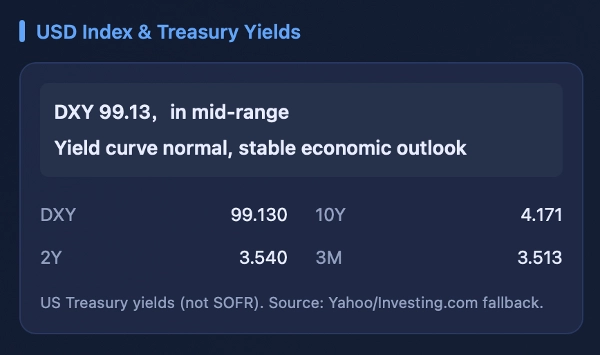
3. Indeks USD & Imbal Hasil Treasury
Sumber Data: Yahoo Finance (utama) / Investing.com (cadangan)
Indikator kunci untuk memahami prospek ekonomi dan kekuatan USD.
• DXY > 105: USD sangat kuat, hambatan komoditas
• DXY < 95: USD sangat lemah, dorongan komoditas
• 10Y-2Y < 0 (Terbalik): Sinyal resesi, risiko turun
• 10Y-2Y > 1% (Curam): Prospek pertumbuhan, risiko naik
Menampilkan: DXY, Imbal Hasil 10Y/2Y/3M, Interpretasi Kurva Imbal Hasil
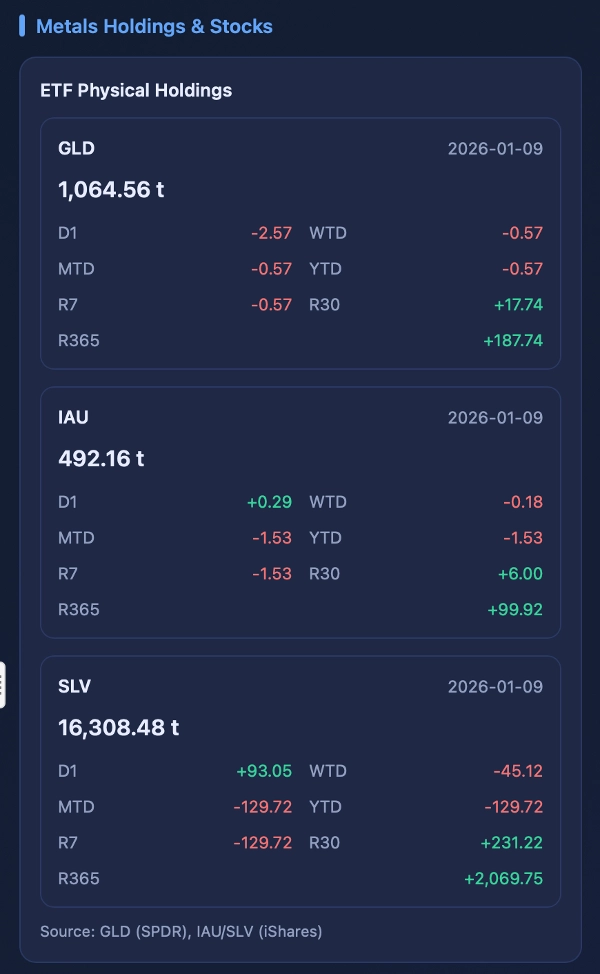
4. Kepemilikan & Stok Logam
Data sisi pasokan logam mulia yang komprehensif.
Sumber Data:
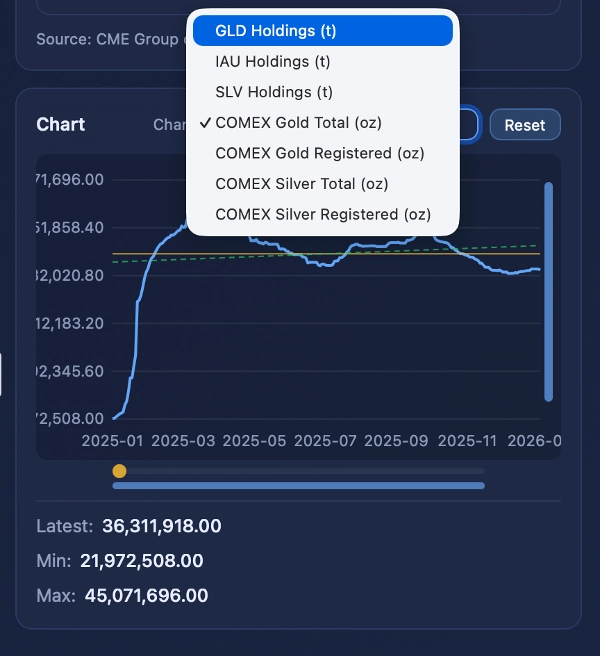
• Kepemilikan ETF: GLD (SPDR), IAU/SLV (iShares)
• Stok COMEX: laporan pengiriman CME Group
Kepemilikan Fisik ETF:
Kepemilikan waktu nyata dalam ton. Naik = akumulasi; Turun = likuidasi.
Menampilkan: Kepemilikan GLD, IAU, SLV
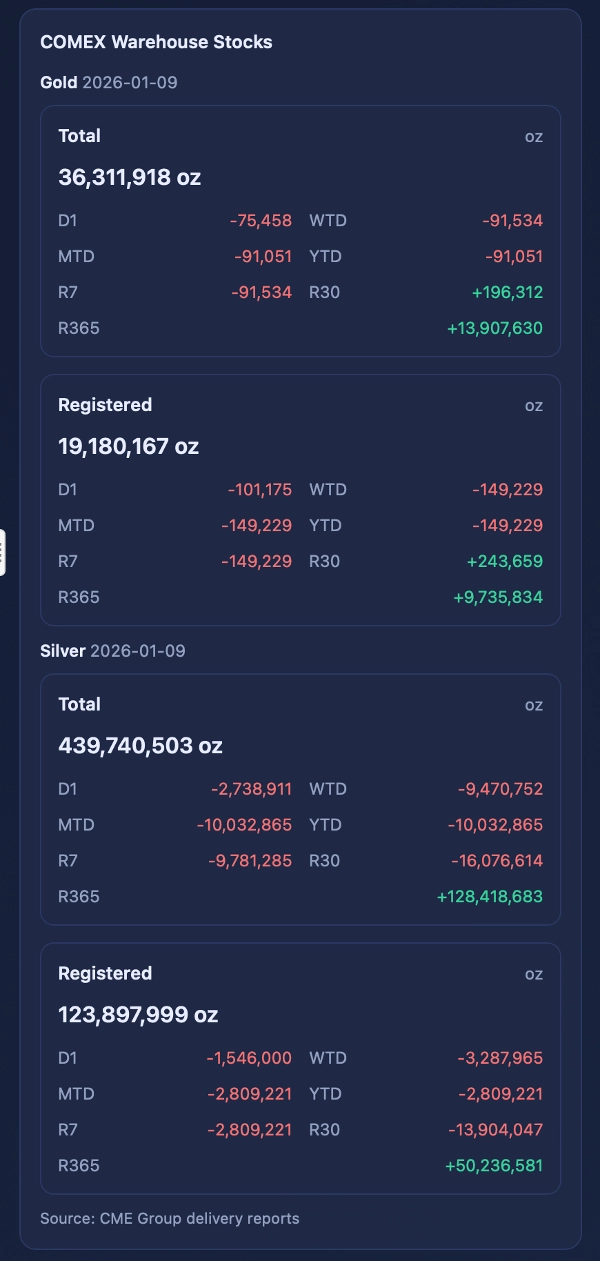
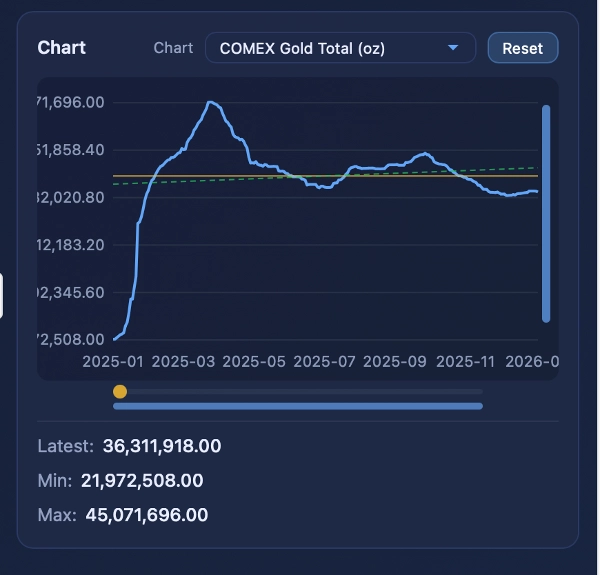
Stok Gudang COMEX:
• Total: Semua logam di gudang COMEX
• Terdaftar: Logam yang tersedia untuk pengiriman futures
Menampilkan: Total & Terdaftar Emas/Perak (oz)
Grafik Logam:
Grafik deret waktu interaktif dengan 7 mode (kepemilikan GLD/IAU/SLV,
Total/ Terdaftar Emas/Perak COMEX). Fitur zoom, pan, gulir,
dan tampilan statistik.
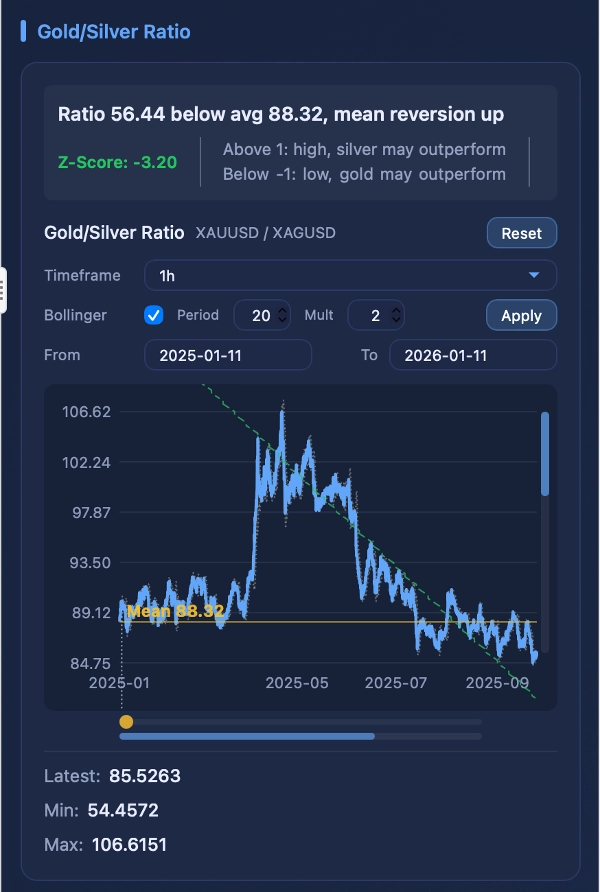
5. Grafik Rasio Emas/Perak
Sumber Data: batang broker cTrader
Rasio (Emas/Perak) menunjukkan valuasi relatif.
Rentang historis: 40-90, rata-rata ~65-70.
• Z > +1: Emas mahal dibanding perak → Perak mungkin berkinerja lebih baik
• Z < -1: Perak mahal dibanding emas → Emas mungkin berkinerja lebih baik
• Z ~ 0: Dekat rata-rata historis → Tidak ada sinyal jelas
Fitur: Zoom/pan interaktif, pemilih rentang waktu (1m hingga Bulanan),
rentang tanggal khusus, Bollinger Bands, garis tren regresi Huber,
Skor-Z dengan kode warna
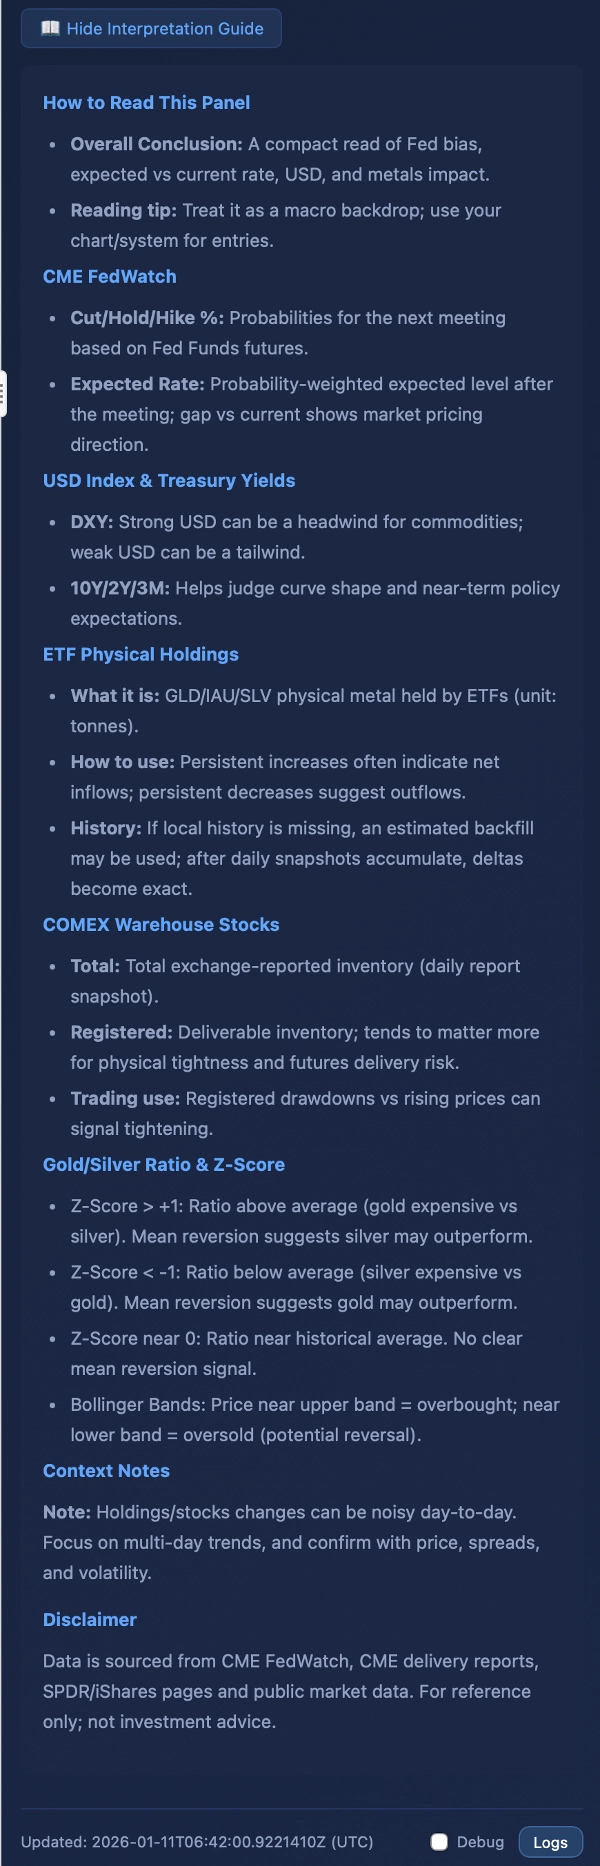
6. Panduan Interpretasi
Bagian referensi yang dapat dilipat menjelaskan bias kebijakan Fed,
interpretasi probabilitas, arti skor Z, dan penggunaan Bollinger Bands.
PARAMETER
──────────
UI: Bahasa (Otomatis/Inggris/Cina)
Sistem: Detik Polling (default 120)
Suku Bunga: Kalibrasi Harian (aktif), Waktu Kalibrasi (21:10 UTC)
Simbol: Simbol Emas/Perak (OTOMATIS atau manual)
Grafik: Rentang Waktu (Harian), Batang Lookback (300)
INTERVAL PEMBARUAN DATA
──────────────────────
CME FedWatch: 2 menit
Yahoo Finance: 5 menit
Investing.com: 15 menit (cadangan)
Kepemilikan ETF: 1 jam
Stok COMEX: 1 jam
PENAFIAN
──────────
FedPulse hanya untuk informasi. Bukan nasihat investasi.
Lakukan riset sendiri sebelum trading.
DUKUNGAN
───────
Pertanyaan atau masukan? Hubungi pengembang melalui marketplace cTrader.