Description
Système intelligent de détection/prédiction de phase MACD
🇫🇮
⭐ MACD PHASE TRACKER ENHANCED™
Adaptatif à la volatilité. Piloté par les prévisions. Intelligence de marché consciente des phases.
Produit professionnel
Le MACD Phase Tracker Enhanced™ est un système d’intelligence de marché de pointe conçu pour les traders qui exigent plus que de simples signaux. Ce n’est pas un indicateur de croisement MACD — c’est un moteur analytique complet qui suit, mesure, prédit et visualise les phases du marché avec une précision chirurgicale.
Basé sur une modélisation avancée de la volatilité, des seuils ATR dynamiques, un suivi probabiliste spécifique aux régimes et des prévisions de phase en temps réel, cet outil vous offre un niveau d’analyse normalement réservé aux plateformes institutionnelles.
Si vous voulez comprendre non seulement ce que fait le marché — mais ce qu’il est statistiquement susceptible de faire ensuite…
voici votre nouvel avantage compétitif.
🎯 Fonctionnalités principales
Détection intelligente des phases MACD
Ce système identifie et suit :
Phases HAUSSIÈRES
Phases BAISSIÈRES
États PLATS / de transition
Chaque phase est surveillée dès son début, avec :
Suivi de la durée
Compteurs de temps en phase
Contexte en temps réel de la pente et de la volatilité
Seuils dynamiques basés sur ATR × volatilité
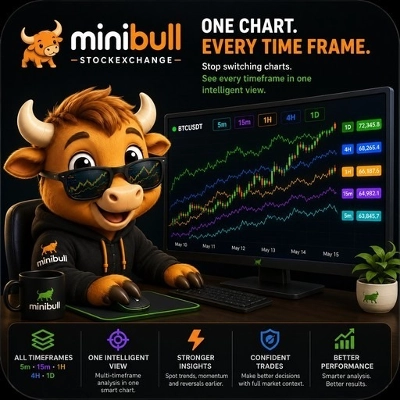
Cela vous donne une vue complète de l’environnement actuel du marché en mode vue rapide à gauche de l’écran
Seuil adaptatif à la volatilité
En utilisant l’ATR et l’écart-type, l’indicateur ajuste automatiquement ses attentes :
Faible volatilité > Seuils serrés
Volatilité moyenne > Seuils modérés
Forte volatilité > Seuils larges
Cela garantit que le succès de la phase est mesuré équitablement, quelles que soient les conditions du marché.
Suivi des mouvements & modélisation de la probabilité de succès
Chaque mouvement HAUT et BAS est enregistré et analysé :
Succès vs échec
Taille moyenne du mouvement
Durée moyenne
Taux de succès spécifiques à la volatilité
Performance historique des croisements
Après cela, vous disposez de l’empreinte statistique du comportement de votre marché...
Prévisions en temps réel
Probabilité de succès du mouvement HAUT prévu
Probabilité de succès du mouvement BAS prévu
Basé par exemple sur ceux-ci (mais pas uniquement) :
Volatilité actuelle
Performance historique
Statistiques des mouvements
Seuils dynamiques et bien d’autres valeurs calculées en temps réel (non ! pas des valeurs actuellement utilisées dans de nombreux autres indicateurs)
C’est de l’analyse prédictive intégrée directement dans votre graphique.
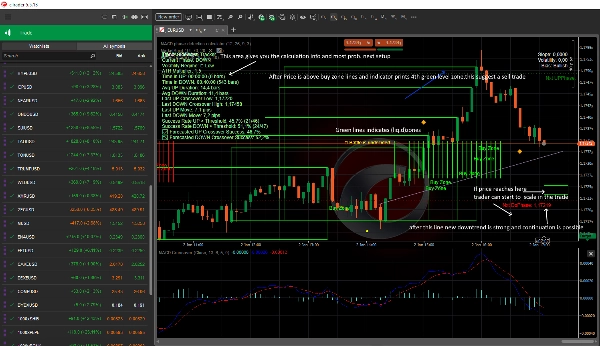
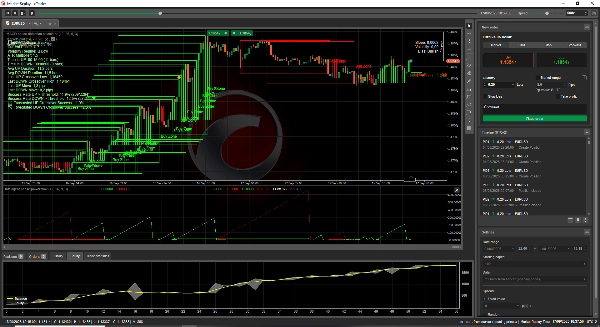
Système de retour visuel
Votre graphique devient un centre de commandement tactique :
Tableau de bord des phases avec statistiques complètes
Lignes cibles dynamiques pour les prochaines phases HAUT et BAS
Point de contrôle clignotant indiquant qui domine actuellement
🟢 Les haussiers contrôlent
🔴 Les baissiers contrôlent
🟡 Bataille indécise
Icônes d’alerte lorsque les mouvements atteignent une signification statistique
Étiquettes de régime de volatilité codées par couleur
Tout est conçu pour être instantanément lisible et visuellement intuitif.
Pourquoi cela fonctionne
Comprenez les phases du marché avec une clarté sans précédent
Tradez avec confiance statistique, pas émotionnelle
Sachez quand un croisement est susceptible de réussir — avant qu’il ne se produise
Voyez les seuils ajustés à la volatilité en temps réel
Suivez la qualité, la durée et la probabilité des mouvements
Identifiez quand les haussiers ou les baissiers prennent le contrôle
Recevez des alertes expressives aux moments clés
C’est le genre d’outil qui transforme votre graphique en machine à prendre des décisions.
Cet indicateur est pour....
Les traders qui s’appuient sur le MACD mais veulent une intelligence plus approfondie
Les traders algorithmiques qui ont besoin d’une logique déterministe et basée sur les données
Les traders swing et intraday qui veulent des entrées conscientes des phases
Les traders sensibles à la volatilité qui ont besoin de seuils adaptatifs
Toute personne souhaitant prévoir le comportement du marché avec un soutien statistique
Où cela fonctionne-t-il ?
Fonctionne sur toutes les unités de temps
Fonctionne sur tous les actifs
La détection intelligente s’adapte aux conditions du marché
Notes
Ceci fait partie d’un système, vous avez besoin des 3 pour obtenir la performance complète
Une partie supplémentaire 4 peut également être acquise où vous obtenez des niveaux avancés de support et résistance basés sur l’action des prix
Les instructions sont envoyées après l’achat, tous les achats
Tous les achats vous donnent droit à rejoindre le serveur Discord.
Fabriqué en Finlande 🇫🇮
⭐ MACD PHASE TRACKER ENHANCED™
Connaître la phase. Mesurer le mouvement. Prévoir l’avenir.