
Beschreibung
Dies ist nicht nur ein weiterer RSI-Roboter mit zufälligen Einstellungen und überangepassten Backtests.
Wenn Sie diesen cBot kaufen, erhalten Sie auch ein vollständiges Analysepaket, das auf umfangreichen quantitativen Tests basiert. Über 1 Million Parameterkombinationen wurden über japanische/Heiken Ashi/Renko-Charts getestet
Wie die Strategie funktioniert
Long Entry
- Ein Long-Signal wird ausgelöst, wenn der RSI nach oben durchkreuzt einen definierten Wert:
(Beispiel: RSI-Wert war 29. Jetzt ist er 31. Er kreuzt Level 30 nach oben. Hier öffnet der cBot eine Long-Position)
Long Exit
- Take Profit (TP) — Cross-Back-Ausgang
Ausgang, wenn der RSI nach unten unter das TP-Level kreuzt. Beispiel: RSI-Wert war 71. Jetzt ist er 69. Er kreuzt Level 70 nach unten. Hier schließt der cBot die Long-Position.
- Schützender Ausstieg — Cross-Back-Ausgang (nur wenn der Trade im Gewinn ist)
Ausgang, wenn der RSI nach unten unter das Schutz-Level kreuzt, aber nur, wenn die Position derzeit profitabel ist.
- Stop Loss (SL) — RSI-Level-Stopp (kein Kreuz erforderlich)
Sofortiger Ausstieg, wenn der RSI-Level das SL berührt. Beispiel: Long-Position bei RSI-Level 30 eröffnen, SL ist 25. Wenn der RSI 25 berührt, wird die Long-Position geschlossen.
Gegenteil für die Short-Position
Positionsverwaltung
- Der Roboter hält immer nur eine Position gleichzeitig pro Symbol.
Signal-Timing
- Signale werden erst nach dem Schließen einer Kerze ausgewertet.
- Wenn ein Signal erscheint, wird der Einstieg zum OPEN der nächsten Kerze ausgeführt (kein Intrabar-Raten und wir können die Strategie richtig bewerten).
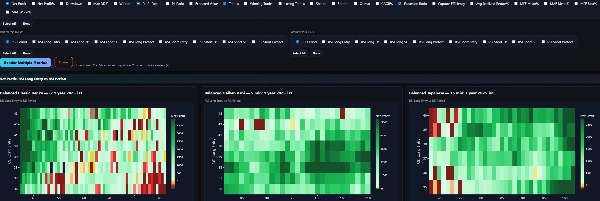
Wie ich Einstellungen validiere
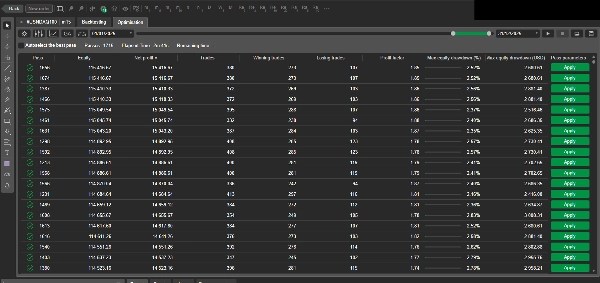
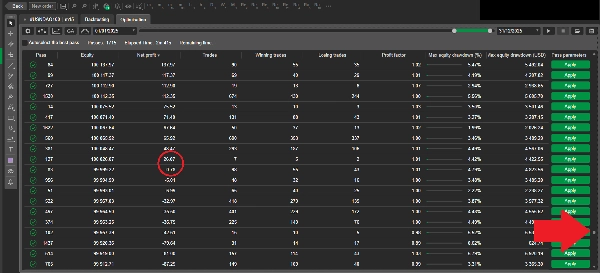
Ich „wähle Parameter nicht nach Gefühl“ oder nur zufällige Werte. Ich teste große Parameterbereiche mit einem genetischen Algorithmus (GA):
- Tausende von Parameterkombinationen werden automatisch bewertet
- Die Auswahl bewahrt Vielfalt, nicht nur die besten Performer (um das Risiko der Überoptimierung zu reduzieren)
- Tests werden über mehrere Perioden, Zeitrahmen und Charttypen (Japanisch / Heiken Ashi / Renko) durchgeführt
Dies erzeugt einen großen Datensatz von Ergebnissen und hilft, stabile Parameterbereiche zu identifizieren, nicht nur eine glückliche Konfiguration. Nach dem ersten GA-Durchlauf führe ich eine zweite Optimierungsphase durch, die sich auf die stabilsten und profitabelsten Parameterbereiche konzentriert.
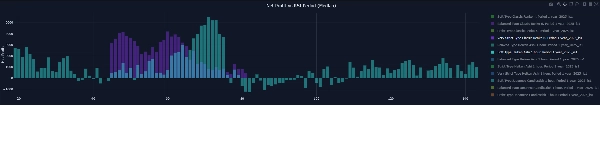
Metriken (kurze Liste)
In der Analyse verfolge ich unter anderem:
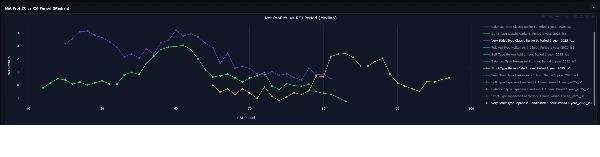
- Nettogewinn, Maximaler Drawdown
- Profitfaktor, Gewinnrate, Erwartungswert
- Sharpe, Sortino, Calmar
- MAE / MFE (Ausflüge)
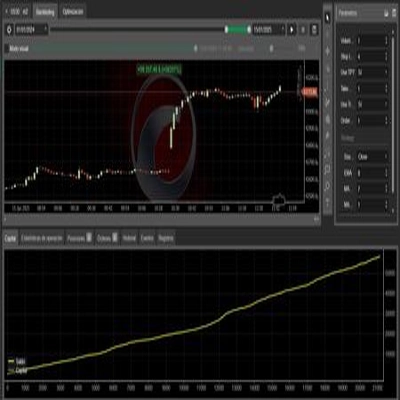
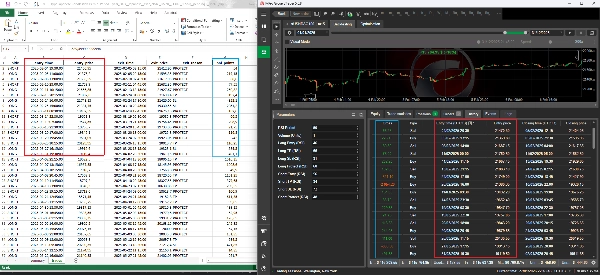
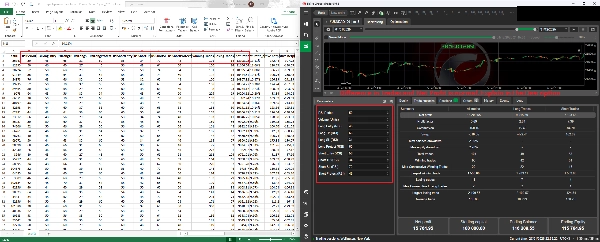
Meine GA-Ergebnisse und cTrader-Backtests können leicht abweichen (und das ist normal)
Wenn Sie meine genetischen Optimierungs(GA)-Ergebnisse mit einem cTrader-Backtest vergleichen, können Sie kleine Unterschiede im Gewinn, Ein-/Ausstiegspreis oder einigen abgeleiteten Metriken feststellen.
Diese Unterschiede sind zu erwarten und resultieren aus zwei kontrollierten Faktoren:
1) Erzwingender Positionsschluss am Ende des Tests (keine „offenen Trades“)
Meine GA-Engine schließt immer jede offene Position an der letzten Kerze des Testzeitraums. Dies verhindert „hängende“ oder schwebende Positionen und macht die Ergebnisse vollständig realisiert und vergleichbar über verschiedene Durchläufe.
In cTrader kann je nach Einstellungen ein Backtest:
- eine Position am Ende offen lassen, oder
- sie anders schließen (Timing/Preis), oder
- die Ausführung der letzten Kerze mit leicht anderen Mechaniken handhaben.
Das allein kann einen kleinen Unterschied im endgültigen Eigenkapital/Gewinn erzeugen.
2) Spread-/Slippage-Effekte bei Volatilitätsspitzen
Reale Märkte (und realistische Simulationen) können gelegentliche Volatilitätsspitzen zeigen, bei denen:
- Spreads sich ausweiten,
- Slippage zunimmt,
- Ausführungspreise leicht abweichen.
Mein GA-Modell beinhaltet Spread + optional Slippage + Kommission, und in seltenen Hochvolatilitätssegmenten kann dies die Ausführungen um einen kleinen Betrag verschieben. Selbst eine winzige Preisverschiebung kann Metriken wie Nettogewinn, Drawdown, Profitfaktor und andere leicht verändern
Trotz dieser kleinen Unterschiede auf Ausführungsebene sind das Verhalten der Strategie und die Ergebnisse direkt vergleichbar:
- Ein- und Ausstiege folgen der gleichen Logik,
- Trades finden in den gleichen Bereichen statt,
- und die wichtigsten Leistungskennzahlen bleiben übereinstimmend.
Wenn Sie möchten:
- vollständiges Analysepaket (T + interaktives Dashboard),
- empfohlene Einstellungen für Ihr Asset/Zeitrahmen,
- oder individuelle Forschung / Strategieentwicklung,
Kontaktieren Sie mich über einen Link in meinem Profil, um Analysen zu erhalten
Risikohinweis: Dieser Roboter dient zu Bildungs- und Forschungszwecken. Der Handel beinhaltet Risiken, und vergangene Leistungen garantieren keine zukünftigen Ergebnisse.
Zusammenfassung
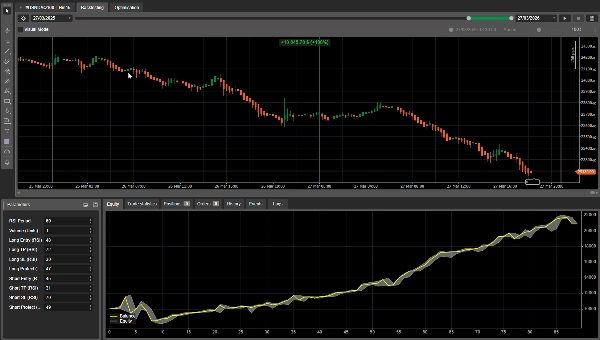
The robot manages one position per symbol at a time and evaluates signals only after bar close, executing trades at the next bar's open to avoid intrabar uncertainty. Parameter settings are optimized through extensive genetic algorithm testing, evaluating over one million parameter combinations across multiple periods, timeframes, and chart types to identify stable and profitable configurations. The package includes a full analytics suite tracking metrics such as net profit, max drawdown, profit factor, Sharpe ratio, and more.
Backtests use 100:1 leverage and market orders, with risk management via fixed lot sizing, take profit, and stop loss tools. Recommended minimum balance is $10,000 with 1% risk per trade and a maximum drawdown of 26.5%. The strategy targets low-frequency trades on instruments including BTCUSD, XAUUSD, NAS100, and indices.
Kundenbewertungen
5 | 0 % | |
4 | 100 % | |
3 | 0 % | |
2 | 0 % | |
1 | 0 % |