
Описание
Это не просто ещё один робот RSI с случайными настройками и переобученными бэктестами.
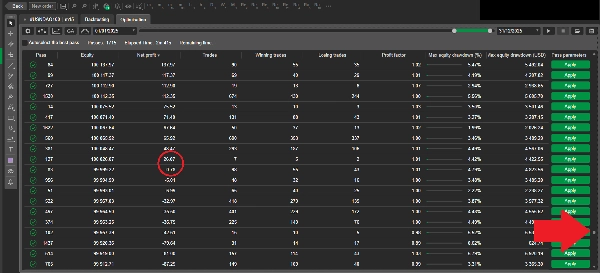
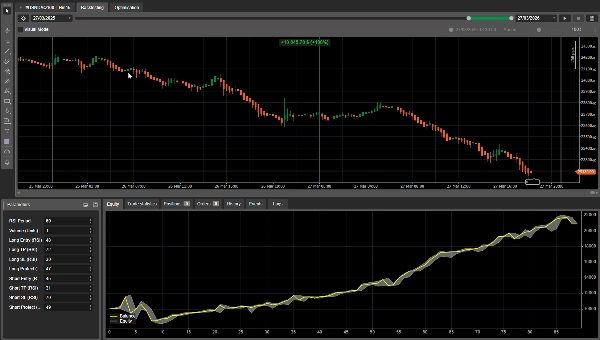
При покупке этого cBot вы также получаете полный пакет аналитики, построенный на основе масштабного количественного тестирования. Более 1 миллиона комбинаций параметров протестировано на японских/Хейкен Аши/Ренко графиках
Как работает стратегия
Вход в лонг
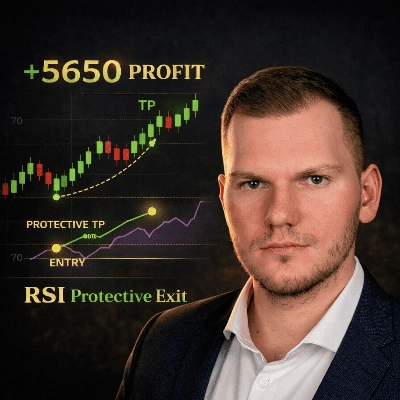
- Сигнал на покупку возникает, когда RSI пересекает уровень вверх:
(Пример: уровень RSI был 29. Теперь 31. Он пересекает уровень 30 вверх. Здесь cBot открывает лонг позицию)
Выход из лонга
- Тейк Профит (TP) — выход при обратном пересечении
Выход при пересечении RSI вниз ниже уровня TP. Пример: уровень RSI был 71. Теперь 69. Он пересекает уровень 70 вниз. Здесь cBot закрывает лонг позицию.
- Защитный выход — выход при обратном пересечении (только если сделка в прибыли)
Выход при пересечении RSI вниз ниже уровня защиты, но только если позиция в данный момент прибыльна.
- Стоп Лосс (SL) — стоп по уровню RSI (пересечение не требуется)
Выход немедленно, если уровень RSI достигает SL. Пример: вход в лонг на уровне RSI 30, SL равен 25. Когда RSI достигает 25, лонг позиция закрывается.
Обратное для короткой позиции
Управление позицией
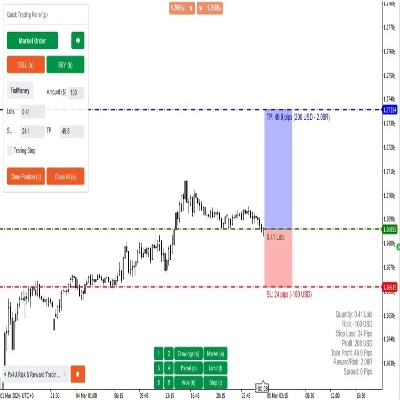
- Робот удерживает только одну позицию одновременно по каждому символу.
Время сигнала
- Сигналы оцениваются только после закрытия бара.
- Если появляется сигнал, вход выполняется на открытии следующего бара (без угадывания внутри бара, что позволяет корректно оценить стратегию).
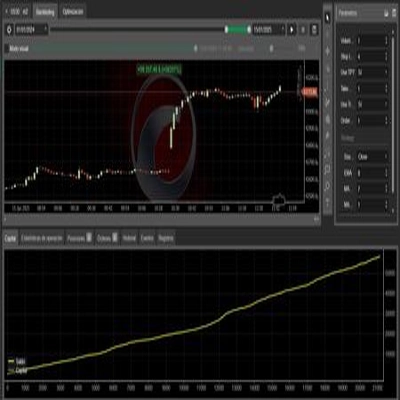
Как я проверяю настройки
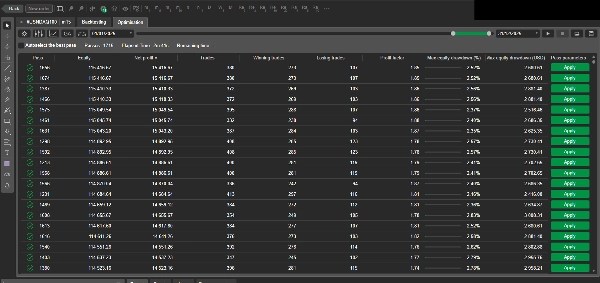
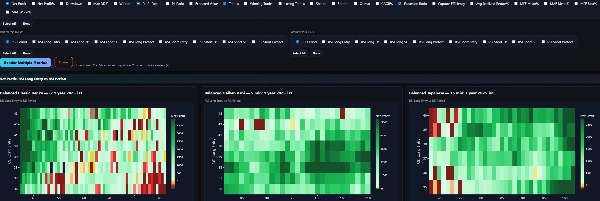
Я не «выбираю параметры на глаз» или просто случайные значения. Я тестирую большие пространства параметров с помощью генетического алгоритма (GA):
- Тысячи комбинаций параметров оцениваются автоматически
- Отбор сохраняет разнообразие, а не только лучших исполнителей (чтобы снизить риск переоптимизации)
- Тестирование проводится на нескольких периодах, таймфреймах и типах графиков (Японские / Хейкен Аши / Ренко)
Это даёт большой набор данных результатов и помогает выявить стабильные области параметров, а не просто одну удачную конфигурацию. После первого прохода GA я запускаю второй этап оптимизации, сосредоточенный на самых стабильных и прибыльных областях параметров.
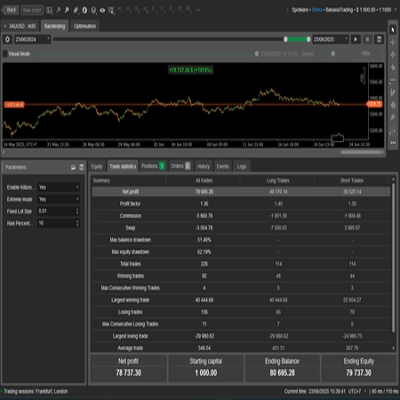
Метрики (краткий список)
В аналитике я отслеживаю, среди прочего:
- Чистая прибыль, Максимальная просадка
- Фактор прибыли, Процент побед, Ожидаемое значение
- Шарп, Сортино, Калмар
- MAE / MFE (экскурсии)
Мои результаты GA и бэктесты cTrader могут немного отличаться (и это нормально)
При сравнении моих результатов генетической оптимизации (GA) с бэктестом cTrader вы можете заметить небольшие различия в прибыли, цене входа/выхода или некоторых производных метриках.
Эти различия ожидаемы и обусловлены двумя контролируемыми факторами:
1) Принудительное закрытие позиции в конце теста (нет «открытых сделок»)
Мой GA движок всегда закрывает любую открытую позицию на последнем баре тестового окна. Это предотвращает «зависание» или плавающие позиции и делает результаты полностью реализованными и сопоставимыми между запусками.
В cTrader, в зависимости от настроек, бэктест может:
- оставлять позицию открытой в конце, или
- закрывать её иначе (по времени/цене), или
- обрабатывать исполнение последнего бара с немного другой механикой.
Это само по себе может создать небольшое различие в итоговом капитале/прибыли.
2) Влияние спреда/проскальзывания во время всплесков волатильности
Реальные рынки (и реалистичные симуляции) могут показывать случайные всплески волатильности, при которых:
- спреды расширяются,
- увеличивается проскальзывание,
- цены исполнения немного отличаются.
Моя модель GA включает спред + опциональное проскальзывание + комиссию, и в редких сегментах с высокой волатильностью это может сдвигать цены исполнения на небольшую величину. Даже небольшой сдвиг цены может слегка изменить такие метрики, как чистая прибыль, просадка, фактор прибыли и другие
Несмотря на эти небольшие различия на уровне исполнения, поведение стратегии и результаты напрямую сопоставимы:
- входы/выходы следуют одной логике,
- сделки происходят в тех же зонах,
- и ключевые показатели эффективности остаются согласованными.
Если вы хотите:
- полный пакет аналитики (T + интерактивная панель),
- рекомендуемые настройки для вашего актива/таймфрейма,
- или индивидуальные исследования / разработку стратегии,
Свяжитесь со мной через ссылку в моём профиле, чтобы получить аналитику
Отказ от ответственности по рискам: Этот робот предназначен для образовательных и исследовательских целей. Торговля связана с риском, и прошлые результаты не гарантируют будущих.
Сводка
The robot manages one position per symbol at a time and evaluates signals only after bar close, executing trades at the next bar's open to avoid intrabar uncertainty. Parameter settings are optimized through extensive genetic algorithm testing, evaluating over one million parameter combinations across multiple periods, timeframes, and chart types to identify stable and profitable configurations. The package includes a full analytics suite tracking metrics such as net profit, max drawdown, profit factor, Sharpe ratio, and more.
Backtests use 100:1 leverage and market orders, with risk management via fixed lot sizing, take profit, and stop loss tools. Recommended minimum balance is $10,000 with 1% risk per trade and a maximum drawdown of 26.5%. The strategy targets low-frequency trades on instruments including BTCUSD, XAUUSD, NAS100, and indices.
Отзывы покупателей
5 | 0 % | |
4 | 100 % | |
3 | 0 % | |
2 | 0 % | |
1 | 0 % |