
説明
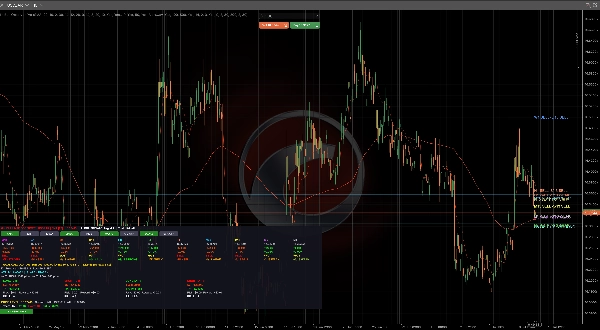
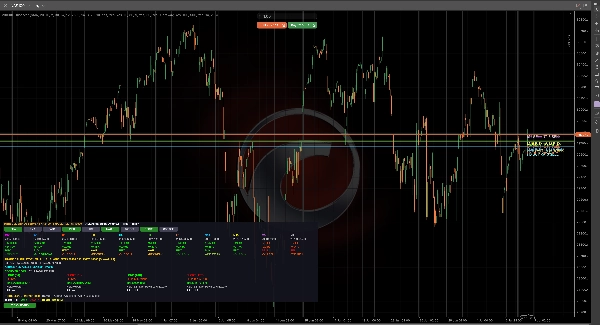
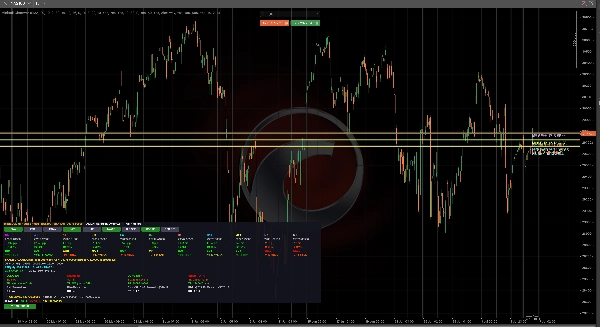
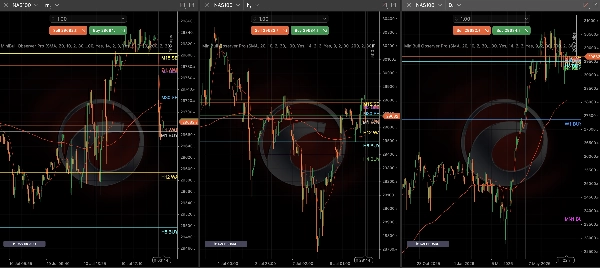
MiniBull Observerは、cTrader向けのマルチタイムフレーム市場バイアスダッシュボードであり、移動平均線、RSI、MACD、ストキャスティクス、CCI、モメンタムを11のタイムフレームにわたって1つの複合スコアに融合しています。市場が強気、弱気、または混合のどれに整合しているかを即座に確認でき、タイムフレームごとの色分けされたシグナルと全体の整合サマリーを提供します。内蔵のトレード計算機は、WilderのATRを使用してSL/TPおよびリスク/リワードを推定し、前日の高値/安値周辺のブレイクアウトシナリオと標準のATRベースのエントリーの両方をカバーします。価格レベル分析モジュールは、オールタイムの高値/安値、レベルテスト、設定可能なルックバック期間にわたるブレイクアウトバイアスを追跡します。コアの移動平均線にはSMA、EMA、またはKAMAを選択でき、チャート上でMAラインとシグナルの切り替えが可能で、色、フォント、パネル位置をカスタマイズできます。オプションのD1レベルアラートは音声通知付きで、重要なブレイクアウトや接近を知らせます。軽量で自己完結型、ファイルやネットワークアクセスを必要とせず、デスクトップおよびクラウドホストのcTraderインスタンスの両方でクリーンに動作します。
概要
AI summary
MiniBull Observer Pro is a multi-timeframe market bias indicator designed for the cTrader platform. It integrates multiple technical indicators—Moving Averages (SMA, EMA, KAMA), RSI, MACD, Stochastic, CCI, and Momentum—into a single composite score across 11 timeframes. The tool provides a clear visual dashboard with color-coded signals indicating bullish, bearish, or mixed market conditions per timeframe, along with an overall alignment summary.
Key features include a built-in Trade Calculator that estimates stop loss, take profit, and risk/reward ratios based on Wilder's ATR, supporting both breakout and ATR-based entry scenarios. The Price Level Analysis module monitors all-time highs/lows, level tests, and breakout bias over a configurable lookback period. Users can customize moving average types, toggle MA lines and signals on the chart, and adjust colors, fonts, and panel positioning.
Optional daily-level alerts with sound notifications inform users of key breakout events. The indicator is lightweight, self-contained, and operates without file or network dependencies, ensuring smooth performance on both desktop and cloud-hosted cTrader environments. It supports visualization, signal generation (cross, reversal, level touch, level break), and filtering based on bar data.
Key features include a built-in Trade Calculator that estimates stop loss, take profit, and risk/reward ratios based on Wilder's ATR, supporting both breakout and ATR-based entry scenarios. The Price Level Analysis module monitors all-time highs/lows, level tests, and breakout bias over a configurable lookback period. Users can customize moving average types, toggle MA lines and signals on the chart, and adjust colors, fonts, and panel positioning.
Optional daily-level alerts with sound notifications inform users of key breakout events. The indicator is lightweight, self-contained, and operates without file or network dependencies, ensuring smooth performance on both desktop and cloud-hosted cTrader environments. It supports visualization, signal generation (cross, reversal, level touch, level break), and filtering based on bar data.
インジケーターのプロフィール
インジケーターのカテゴリー
トレンド
出力の種類
ビジュアル表示
シグナル
フィルター
データ要件
バーのみ
サポート対象のシグナル
クロス
反転
ラインタッチ
ラインブレイク
カスタマーレビュー
5.0
レビュー: 1
5 | 100 % | |
4 | 0 % | |
3 | 0 % | |
2 | 0 % | |
1 | 0 % |
カスタマーレビュー
July 19, 2026
MiniBull OPis a powerful MTF dashboard that aggregates MA, RSI, MACD, Stochastic, CCI, and Momentum into a composite bias score across 11 timeframes. It eliminates the need for multiple indicator windows. The built-in ATR Trade Calculator and Price Level Analysis module are fantastic additions for risk management and breakout tracking. While the dashboard can overwhelm mobile screens and uses lagging components, it’s a top-tier tool for desktop traders seeking instant multi-timeframe confluence.
ディスカッション
よくあるご質問
EMA
SMA
RSI
MACD
Moving Average
Stochastic
CCI
cTrader Storeで入手可能な取引ボット、インジケーター、プラグインなどの商品は、第三者の開発者が提供するものであり、情報と技術の取得のみを目的としてご利用いただけます。cTrader Storeはブローカーではなく、投資助言や個人的な推奨を行うことも、将来のパフォーマンスを保証することもありません。