
Descrição
R3.Alpha Analytics transforma seu histórico de negociações cTrader em um relatório de desempenho e risco de nível institucional — automaticamente, sem entrada manual. Ele lê suas negociações fechadas e calcula um conjunto quantitativo completo em dez abas:
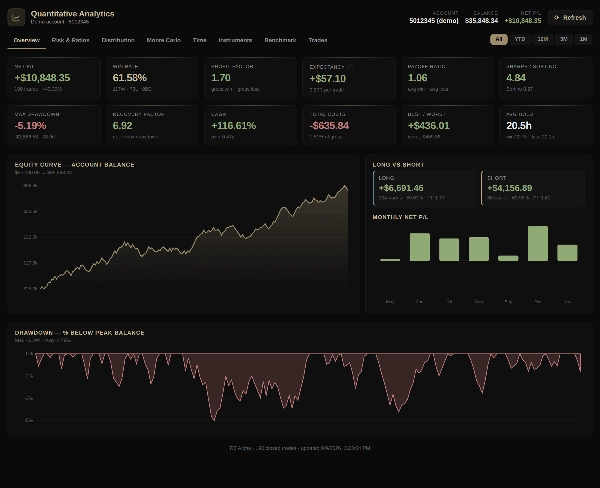
- Visão Geral — lucro/prejuízo líquido, retorno total %, retorno médio mensal, taxa de acerto, fator de lucro, expectativa, CAGR, máxima queda, curva de patrimônio e divisão entre posições longas e curtas.
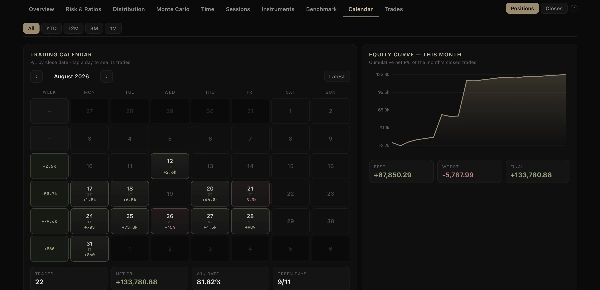
- Calendário — um calendário diário de lucro/prejuízo com totais semanais, visualização diária ao toque e visão geral anual.
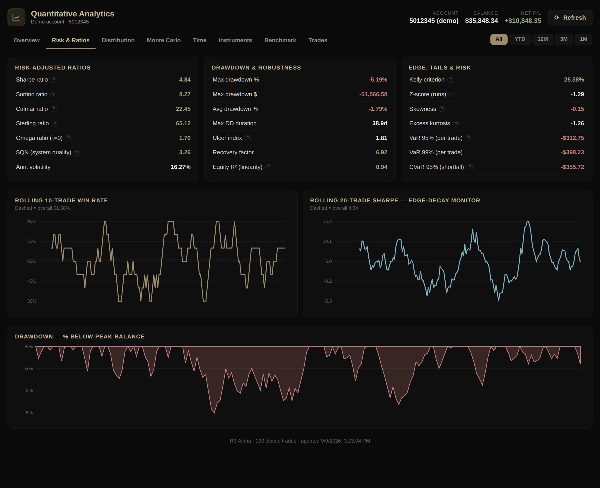
- Risco & Índices — Sharpe, Sortino, Calmar, Sterling, Omega, SQN, VaR/CVaR, índice de úlcera, fator de recuperação, taxa de acerto móvel e Sharpe móvel.
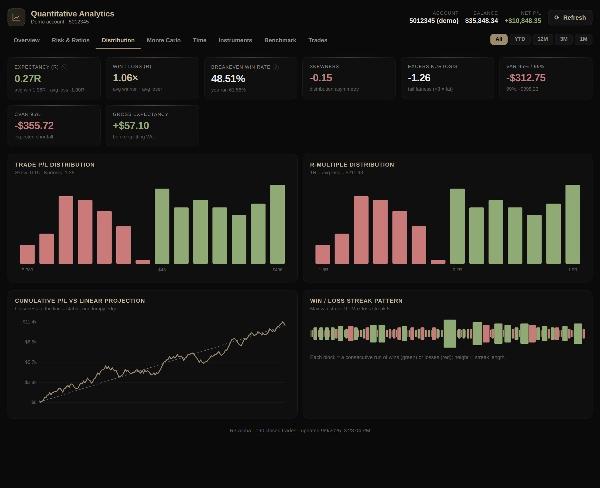
- Distribuição — múltiplos R, assimetria, curtose, histograma de lucro/prejuízo e sequências de vitórias/derrotas.
- Monte Carlo — risco de ruína, probabilidade de lucro, simulações de quedas e percentis de patrimônio.
- Tempo — desempenho por dia da semana, hora, mês e tempo de manutenção.
- Sessões — Ásia, Londres, sobreposição Londres–NY e Nova York comparados por força e qualidade, com os pares de melhor desempenho em cada sessão.
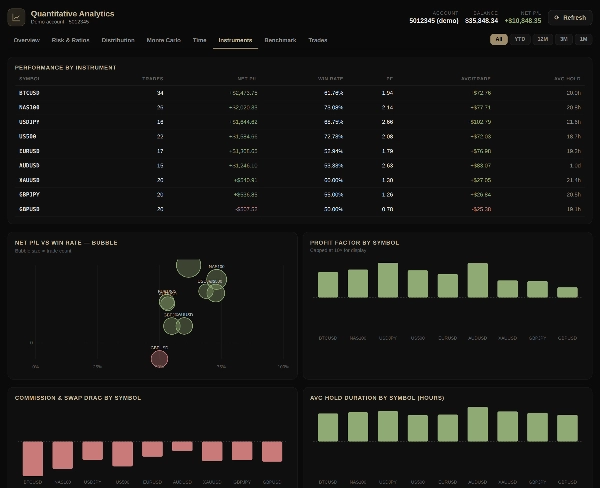
- Instrumentos — resultados, fator de lucro, custos e tempo de manutenção por símbolo.
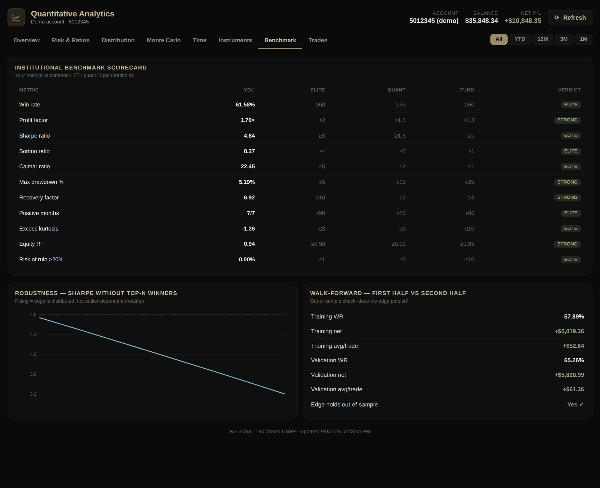
- Referência — um placar contra limites de HFT, quant e fundos, com validação walk-forward.
- Negociações — o registro completo de negociações com preços de entrada e saída, tempo de manutenção, swaps e comissões.
Cada gráfico é interativo. Filtros de período (Todos, YTD, 12M, 3M, 1M) recalculam cada métrica nos limites do calendário, e um interruptor Posições / Fechamentos permite contar cada posição como uma negociação ou combinar com as próprias estatísticas do cTrader, onde cada fechamento parcial é uma negociação separada. O plugin é estritamente somente leitura e nunca realiza negociações. Use-o para auditar sua vantagem, monitorar quedas e consistência, e ver exatamente como seu sistema performa.
Resumo
1. Overview: net profit/loss, win rate, profit factor, expectancy, CAGR, and drawdown.
2. Risk & Ratios: metrics such as Sharpe, Sortino, Calmar, Sterling, Omega, SQN, VaR/CVaR, Ulcer index, and recovery factor.
3. Distribution: analysis of R-multiples, skewness, kurtosis, and profit/loss histograms.
4. Monte Carlo simulations: risk of ruin, probability of profit, and equity percentiles.
5. Time and instrument breakdowns.
6. Benchmark scorecard: compares performance against high-frequency trading, quantitative, and fund thresholds with walk-forward validation.
7. Full trade log.
All charts are interactive with period filters that dynamically update metrics. The plugin operates in read-only mode and does not place trades. It is intended for auditing trading edge, monitoring drawdowns and consistency, and detailed system performance evaluation.
Avaliações de clientes
5 | 100 % | |
4 | 0 % | |
3 | 0 % | |
2 | 0 % | |
1 | 0 % |