الوصف
نظام نماذج الكشف/التنبؤ بمرحلة MACD الذكي
🇫🇮
⭐ MACD PHASE TRACKER ENHANCED™
ذكاء سوق متكيف مع التقلبات، مدفوع بالتنبؤ، وواعٍ بالمرحلة.
منتج احترافي
يعد MACD Phase Tracker Enhanced™ نظام ذكاء سوق متطور مصمم للمتداولين الذين يطلبون أكثر من إشارات بسيطة. هذا ليس مؤشر تقاطع MACD — إنه محرك تحليلي كامل يتتبع ويقيس ويتنبأ ويصور مراحل السوق بدقة جراحية.
مبني على نمذجة متقدمة للتقلبات، عتبات ATR ديناميكية، تتبع احتمالات خاصة بالنظام، وتنبؤات مرحلية في الوقت الحقيقي، يمنحك هذا الأداة مستوى من الرؤية عادة ما يكون محجوزًا لمنصات التحليلات المؤسسية.
إذا كنت تريد أن تفهم ليس فقط ما يفعله السوق — بل ما من المحتمل إحصائيًا أن يفعله بعد ذلك…
هذه هي ميزتك التنافسية الجديدة.
🎯 القدرات الأساسية
الكشف الذكي عن مرحلة MACD
يحدد هذا النظام ويتتبع:
مراحل الصعود
مراحل الهبوط
الحالات المستوية / الانتقالية
يتم مراقبة كل مرحلة من لحظة بدايتها، مع:
تتبع المدة
عدادات الوقت في المرحلة
سياق الميل والتقلب في الوقت الحقيقي
عتبات ديناميكية بناءً على ATR × التقلب
هذا يمنحك صورة كاملة لبيئة السوق الحالية في وضع العرض السريع على الجانب الأيسر من الشاشة
عتبة متكيفة مع التقلب
باستخدام ATR والانحراف المعياري، يقوم المؤشر بضبط توقعاته تلقائيًا:
تقلب منخفض > عتبات ضيقة
تقلب متوسط > عتبات معتدلة
تقلب عالي > عتبات واسعة
هذا يضمن قياس نجاح المرحلة بشكل عادل، بغض النظر عن ظروف السوق.
تتبع الحركة ونمذجة احتمالية النجاح
يتم تسجيل وتحليل كل حركة صعود وهبوط:
النجاح مقابل الفشل
متوسط حجم الحركة
متوسط المدة
معدلات النجاح الخاصة بالتقلب
أداء التقاطع التاريخي
بعد ذلك لديك بصمة إحصائية لسلوك سوقك...
التنبؤ في الوقت الحقيقي
احتمالية نجاح حركة الصعود المتوقعة
احتمالية نجاح حركة الهبوط المتوقعة
مثال مبني على هذه (ولكن ليس محدودًا بها):
التقلب الحالي
الأداء التاريخي
إحصائيات الحركة
العتبات الديناميكية والعديد من القيم الأخرى المحسوبة في الوقت الحقيقي (لا! ليست القيم المستخدمة حاليًا في العديد من المؤشرات الأخرى)
هذه تحليلات تنبؤية مدمجة مباشرة في مخططك.
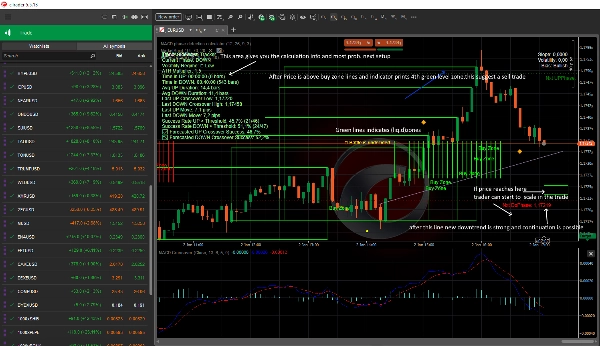
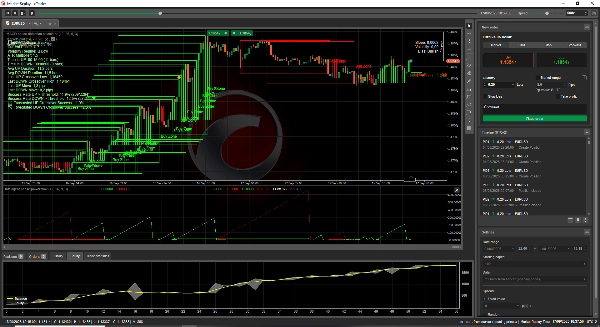
نظام التغذية البصرية
يصبح مخططك مركز قيادة تكتيكي:
لوحة مراحل مع إحصائيات كاملة
خطوط هدف ديناميكية للمراحل الصاعدة والهابطة القادمة
نقطة تحكم وامضة تظهر من يهيمن حاليًا
🟢 الثيران في السيطرة
🔴 الدببة في السيطرة
🟡 المعركة غير محسومة
أيقونات تنبيه عندما تصل الحركات إلى دلالة إحصائية
علامات نظام التقلب الملونة
كل شيء مصمم ليكون قابلاً للقراءة على الفور وبديهيًا بصريًا.
لماذا يعمل هذا
فهم مراحل السوق بوضوح غير مسبوق
التداول بثقة إحصائية، وليس بالعاطفة
معرفة متى من المحتمل أن ينجح التقاطع — قبل حدوثه
رؤية العتبات المعدلة حسب التقلب في الوقت الحقيقي
تتبع جودة الحركة، المدة، والاحتمالية
تحديد متى يسيطر الثيران أو الدببة
تلقي تنبيهات معبرة في اللحظات الرئيسية
هذه هي الأداة التي تحول مخططك إلى آلة لاتخاذ القرار.
هذا المؤشر مخصص لـ....
المتداولين الذين يعتمدون على MACD لكنهم يريدون ذكاء أعمق
المتداولين الخوارزميين الذين يحتاجون إلى منطق حتمي مدفوع بالبيانات
متداولي السوينغ واليوم الذين يريدون دخولًا واعيًا بالمرحلة
المتداولين الحساسين للتقلب الذين يحتاجون إلى عتبات متكيفة
أي شخص يريد التنبؤ بسلوك السوق بدعم إحصائي
أين يعمل هذا؟
يعمل على جميع الأطر الزمنية
يعمل على جميع الأصول
الكشف الذكي يتكيف مع ظروف السوق
ملاحظات
هذا جزء من النظام، تحتاج إلى الثلاثة كاملة للحصول على الأداء الكامل
يمكن أيضًا الحصول على الجزء الرابع الإضافي حيث تحصل على مستويات دعم ومقاومة متقدمة بناءً على حركة السعر
يتم إرسال التعليمات بعد الشراء، جميع المشتريات
جميع المشتريات تتيح لك الانضمام إلى خادم Discord.
صنع في فنلندا 🇫🇮
⭐ MACD PHASE TRACKER ENHANCED™
اعرف المرحلة. قس الحركة. تنبأ بالمستقبل.