
설명
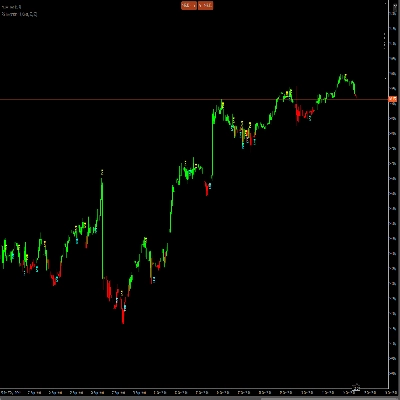
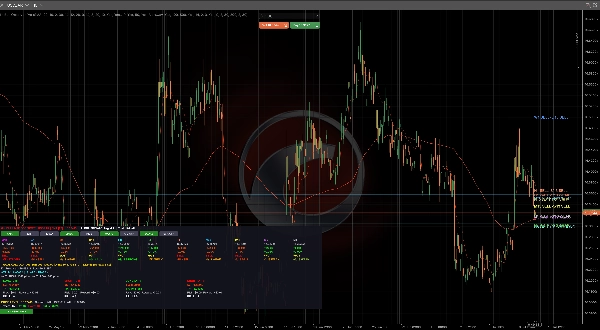
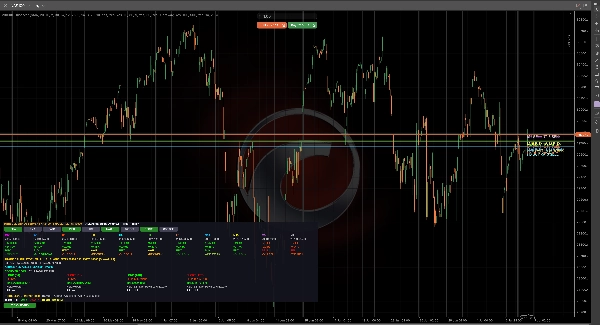
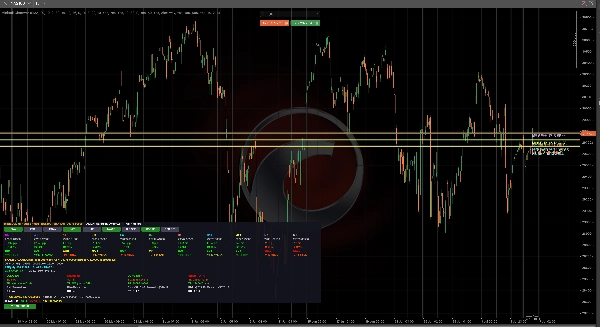
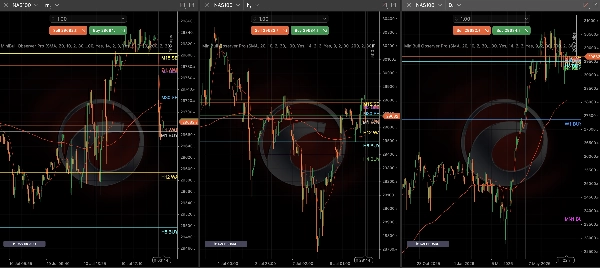
MiniBull Observer는 cTrader용 다중 시간대 시장 편향 대시보드로, 이동 평균, RSI, MACD, 스토캐스틱, CCI 및 모멘텀을 11개 시간대에 걸쳐 하나의 복합 점수로 결합합니다. 색상으로 구분된 시간대별 신호와 전체 정렬 요약을 통해 시장이 강세, 약세 또는 혼합 상태인지 즉시 확인할 수 있습니다. 내장된 거래 계산기는 Wilder의 ATR을 사용하여 SL/TP 및 위험/보상을 추정하며, 이전 일일 고가/저가 주변의 돌파 시나리오와 표준 ATR 기반 진입을 모두 다룹니다. 가격 수준 분석 모듈은 전고점/저점, 수준 테스트 및 구성 가능한 조회 기간 동안의 돌파 편향을 추적합니다. 핵심 이동 평균으로 SMA, EMA 또는 KAMA를 선택하고, 차트에서 MA 선과 신호를 전환하며, 색상, 글꼴 및 패널 위치를 사용자 지정할 수 있습니다. 선택적 D1 수준 알림과 소리 알림으로 주요 돌파 및 접근 상황을 알려줍니다. 경량이며 자체 포함되어 파일이나 네트워크 접근이 필요 없으므로 데스크톱과 클라우드 호스팅 cTrader 인스턴스 모두에서 깔끔하게 실행됩니다.
요약
AI summary
MiniBull Observer Pro is a multi-timeframe market bias indicator designed for the cTrader platform. It integrates multiple technical indicators—Moving Averages (SMA, EMA, KAMA), RSI, MACD, Stochastic, CCI, and Momentum—into a single composite score across 11 timeframes. The tool provides a clear visual dashboard with color-coded signals indicating bullish, bearish, or mixed market conditions per timeframe, along with an overall alignment summary.
Key features include a built-in Trade Calculator that estimates stop loss, take profit, and risk/reward ratios based on Wilder's ATR, supporting both breakout and ATR-based entry scenarios. The Price Level Analysis module monitors all-time highs/lows, level tests, and breakout bias over a configurable lookback period. Users can customize moving average types, toggle MA lines and signals on the chart, and adjust colors, fonts, and panel positioning.
Optional daily-level alerts with sound notifications inform users of key breakout events. The indicator is lightweight, self-contained, and operates without file or network dependencies, ensuring smooth performance on both desktop and cloud-hosted cTrader environments. It supports visualization, signal generation (cross, reversal, level touch, level break), and filtering based on bar data.
Key features include a built-in Trade Calculator that estimates stop loss, take profit, and risk/reward ratios based on Wilder's ATR, supporting both breakout and ATR-based entry scenarios. The Price Level Analysis module monitors all-time highs/lows, level tests, and breakout bias over a configurable lookback period. Users can customize moving average types, toggle MA lines and signals on the chart, and adjust colors, fonts, and panel positioning.
Optional daily-level alerts with sound notifications inform users of key breakout events. The indicator is lightweight, self-contained, and operates without file or network dependencies, ensuring smooth performance on both desktop and cloud-hosted cTrader environments. It supports visualization, signal generation (cross, reversal, level touch, level break), and filtering based on bar data.
지표 프로필
지표 카테고리
추세
출력 유형
시각화
신호
필터
데이터 요구 사항
막대만
지원되는 신호
크로스
반전
레벨 터치
레벨 돌파
고객 리뷰
5.0
리뷰: 1
5 | 100 % | |
4 | 0 % | |
3 | 0 % | |
2 | 0 % | |
1 | 0 % |
고객 리뷰
July 19, 2026
MiniBull OPis a powerful MTF dashboard that aggregates MA, RSI, MACD, Stochastic, CCI, and Momentum into a composite bias score across 11 timeframes. It eliminates the need for multiple indicator windows. The built-in ATR Trade Calculator and Price Level Analysis module are fantastic additions for risk management and breakout tracking. While the dashboard can overwhelm mobile screens and uses lagging components, it’s a top-tier tool for desktop traders seeking instant multi-timeframe confluence.
상담
자주 묻는 질문(FAQ)
EMA
SMA
RSI
MACD
Moving Average
Stochastic
CCI
트레이딩 봇, 지표, 플러그인 등 cTrader Store에서 제공되는 상품은 제3자 개발자에 의해 제공되며, 이는 단순히 정보 및 기술적 접근을 목적으로 제공된 것입니다. cTrader Store는 중개인이 아니며, 투자 조언, 개인별 추천 또는 향후 성과에 대한 어떠한 보장도 제공하지 않습니다.