


Penerangan
XAUUSD H1 Adaptive Breakout cBot - Dibina Khusus untuk Rejim Pasaran Emas Selepas $4,000
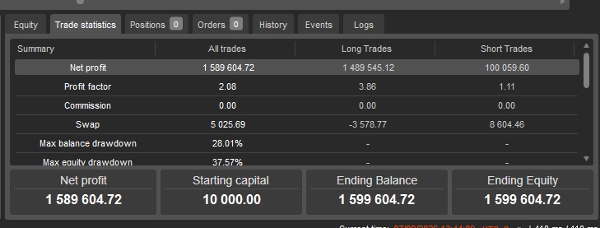
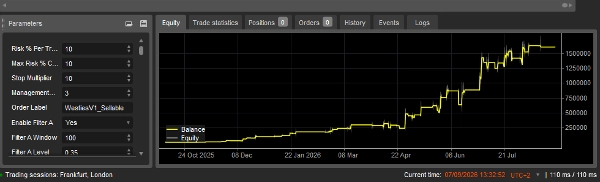
Keputusan ditunjukkan pada dua tetapan risiko. Kedua-dua ujian menggunakan logik strategi yang sama pada tempoh yang sama dan mengambil isyarat yang sama; hanya saiz posisi berbeza. Ujian semula adalah dari 8 Oktober 2025 → 1 September 2026
Baki awal: $10,000
Risiko 10% — tetapan lalai yang dihantar
Baki akhir
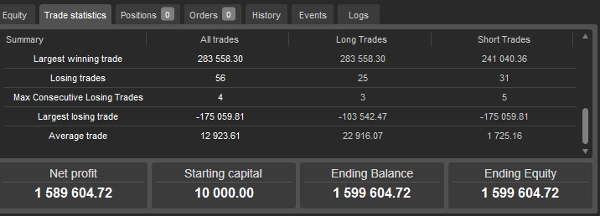
$1,599,604.72
Keuntungan bersih
$1,589,604.72
Pendaraban baki akhir
160×
Faktor keuntungan
Jumlah dagangan
123
Dagangan menang / kalah
67 / 56 (kadar kemenangan 54.5%)
Kehilangan berturut-turut maksimum
4
Purata dagangan
$12,923.61
Dagangan menang terbesar
$283,558.30
Penurunan baki maksimum
Swap bersih
+$5,025.69
Risiko 2%
Baki akhir
$48,797.33
Keuntungan bersih
$38,797.33
Pendaraban baki akhir
4.88×
Faktor keuntungan
Penurunan baki maksimum
Swap bersih
+$47.05
PEMANTAUAN HADAPAN — MYFXBOOK
Selain maklumat ujian sejarah di atas, AlgoTrade sedang dipantau secara langsung pada akaun Pepperstone cTrader khusus melalui Myfxbook.
Pengguna boleh mengikuti rekod prestasi AlgoTrade yang sedang berkembang di Myfxbook, termasuk prestasi dan penurunan baki apabila dagangan baru diselesaikan.
Pautan pemantauan Myfxbook tersedia di profil cTrader pembangun.
PENTING — SILA BACA SEBELUM MELAKUKAN BACKTEST
XAUUSD H1 Adaptive Breakout cBot dibangunkan khusus untuk persekitaran pasaran Emas yang diperhatikan dari 8 Oktober 2025 dan seterusnya, selepas Emas melintasi paras harga $4,000.
Tempoh penilaian/ujian yang disyorkan: 8 Oktober 2025 → Kini
Strategi ini tidak dibangunkan atau dikalibrasi berdasarkan tingkah laku pasaran Emas sebelum $4,000. Pengguna bebas menguji tempoh sejarah yang lebih awal; namun, keputusan dari tempoh tersebut tidak seharusnya dijangka mewakili rejim pasaran yang direka untuk strategi ini.
Mengapa 8 Oktober 2025 Penting
Emas tidak berdagang dengan satu watak yang konsisten sepanjang sejarah moden. Dari masa ke masa, XAUUSD telah melalui rejim pasaran yang berbeza dengan ketara — dari momentum yang dipacu inflasi dan tempoh pengukuhan yang panjang kepada volatiliti akibat krisis, pasaran lembu struktur dan pergerakan harga makro yang semakin pantas.
Apabila Emas melintasi paras $4,000 pada 8 Oktober 2025, kami mengenal pasti persekitaran pasaran yang menunjukkan ciri-ciri yang sangat relevan untuk strategi ini, termasuk pergerakan harga yang lebih besar, pembalikan yang lebih cepat dan aktiviti yang dipacu oleh breakout yang meningkat.
Daripada menganggap bahawa strategi breakout yang dibangunkan berdasarkan tingkah laku Emas yang lama akan kekal sesuai di bawah keadaan baru ini, kami mengambil pendekatan khusus rejim.
Bekerjasama dengan pasukan pakar kami, XAUUSD H1 Adaptive Breakout cBot dibina, diuji dan diperhalusi khusus berdasarkan tingkah laku harga yang diperhatikan dalam rejim Emas yang baru ini.
Apa Maksud Ini untuk Backtesting
Apabila menilai cBot secara bebas, pengguna harus memberi penekanan utama pada keputusan yang dijana dari 8 Oktober 2025 dan seterusnya.
Mengujikan tempoh yang jauh lebih awal mungkin menghasilkan keputusan yang berbeza secara material. Ini tidak semestinya menunjukkan strategi tidak berfungsi; tempoh tersebut mewakili keadaan pasaran di luar rejim yang mana strategi semasa dibangunkan dan dikalibrasi.
Data awal masih berguna untuk penyelidikan, perbandingan dan memahami bagaimana strategi berkelakuan di bawah keadaan sejarah yang berbeza.
Direka untuk Rejim Semasa
Prinsip utama di sebalik cBot ini adalah bahawa tingkah laku pasaran boleh berubah.
Strategi ini dicipta sebagai tindak balas kepada perubahan tingkah laku Emas yang diperhatikan dan bukan berdasarkan andaian bahawa ciri-ciri pasaran sejarah kekal kekal.
Oleh itu, strategi ini mungkin terus dikaji semula apabila pasaran Emas berkembang. Apabila perubahan struktur pasaran yang ketara membenarkan penyesuaian, versi masa depan mungkin diperhalusi sewajarnya.
Prestasi sejarah dan hadapan tidak menjamin keputusan masa depan. Perdagangan XAUUSD melibatkan risiko yang besar.
Bagaimana Strategi Mengenal Pasti Breakout
cBot tidak hanya masuk apabila harga bergerak melebihi paras tertinggi sebelumnya atau di bawah paras terendah sebelumnya.
Ia menggunakan pencetus tindakan harga proprietari berdasarkan struktur lilin jangka pendek untuk mengenal pasti bila tingkah laku harga semasa menyimpang dengan ketara dari tempoh rujukan baru-baru ini.
Pengesahan arah dan momentum diperoleh daripada tindakan harga di titik kemasukan yang berpotensi.
Model kemasukan berfungsi dari data harga OHLC standard. ATR tidak digunakan sebagai pencetus kemasukan. Ukuran yang diperoleh daripada volum digunakan dalam penapisan sistem dan seni bina pengurusan rejim.
Logik perbandingan tepat dan gabungan syarat sengaja tidak didedahkan kerana ia merupakan sebahagian daripada metodologi proprietari strategi.
Pengesahan Sebelum Penggunaan Modal
Ciri utama sistem adalah ia tidak hanya mengesan breakout dan masuk serta-merta.
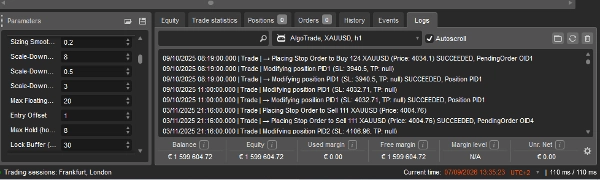
Apabila satu setup sah dikenal pasti, cBot meletakkan pesanan tertunda yang memerlukan harga meneruskan arah yang dijangka sebelum posisi dibuka.
Setup tindakan harga → pengesahan arah → pesanan tertunda → kesinambungan → pelaksanaan dagangan
Tujuannya adalah untuk menapis sebahagian daripada percubaan breakout awal yang gagal diteruskan. Dalam ujian rujukan, 37 daripada 159 isyarat (23%) dibatalkan tanpa pernah diisi, kerana kesinambungan yang diperlukan tidak berlaku.
Dikalibrasi Dari Bar Satu
Penapis sistem adalah statistik dan memerlukan sejarah untuk dikalibrasi dengan betul. Semasa permulaan, cBot memuatkan sejarah pasaran tambahan sebelum dagangan bermula, jadi satu contoh yang dilancarkan hari ini berkelakuan sama seperti yang telah berjalan selama beberapa bulan.
Ini penting untuk penilaian: tanpa ini, satu contoh yang baru dimulakan boleh berkelakuan berbeza daripada ujian semula dalam tempoh yang sama. Oleh itu, pengguna harus melihat kelakuan yang konsisten sama ada mereka memulakan cBot pada bila-bila masa dalam kitaran pasaran.
Pengurusan Risiko Adaptif
Saiz posisi adalah berdasarkan peratusan dan dinamik dan bukannya saiz lot tetap. cBot mengira saiz posisi dari baki akaun dan jarak hentian yang ditentukan secara dinamik untuk setiap dagangan.
Parameter risiko
Saiz posisi
Dinamik, berdasarkan baki dan struktur
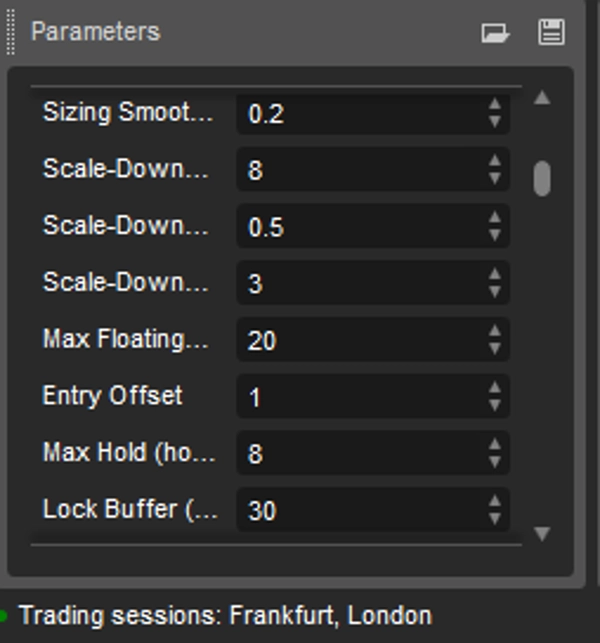
Posisi maksimum serentak:
3
Masa pegangan maksimum:
8 jam
Akaun praktikal minimum:
$1500
Baki permulaan yang disyorkan:
$3,500
Leverage:
Ditentukan oleh broker/akaun pedagang, tidak ditetapkan oleh cBot
Sila baca ini dengan teliti. Pada tetapan lalainya, ini adalah sistem agresif dengan varians tinggi. Saiz posisi dikira dari jarak rujukan struktur, manakala hentian pelindung diletakkan jauh lebih lebar daripada rujukan itu. Akibat praktikalnya adalah bahawa dagangan rugi individu boleh menyebabkan kerugian yang jauh lebih besar daripada peratusan risiko nominal yang dicadangkan.
Diukur sebagai bahagian daripada baki akaun, dagangan rugi tunggal terbesar adalah -6.74% pada tetapan risiko 2%. Pada 10% lalai, kesan yang sama meningkat secara berkadar, dan kerugian tunggal terbesar dalam ujian itu adalah -$175,059.81 berbanding baki puncak yang berjumlah jutaan. Kebanyakan posisi rugi ditutup oleh pengurusan berasaskan masa sistem jauh sebelum hentian pelindung dicapai, tetapi pengguna mesti bersedia untuk kerugian individu sekali-sekala. Peratusan risiko adalah boleh dikonfigurasikan sepenuhnya — lihat "Memilih Tahap Risiko Anda" di bawah, dan bahagian ujian semula untuk angka pada kedua-dua 2% dan 10%.
Pendedahan risiko juga dikurangkan secara automatik apabila sistem mengesan bahawa keadaan pasaran semasa menjadi kurang menguntungkan. Metodologi pelarasan risiko tepat adalah proprietari.
Memilih Tahap Risiko Anda
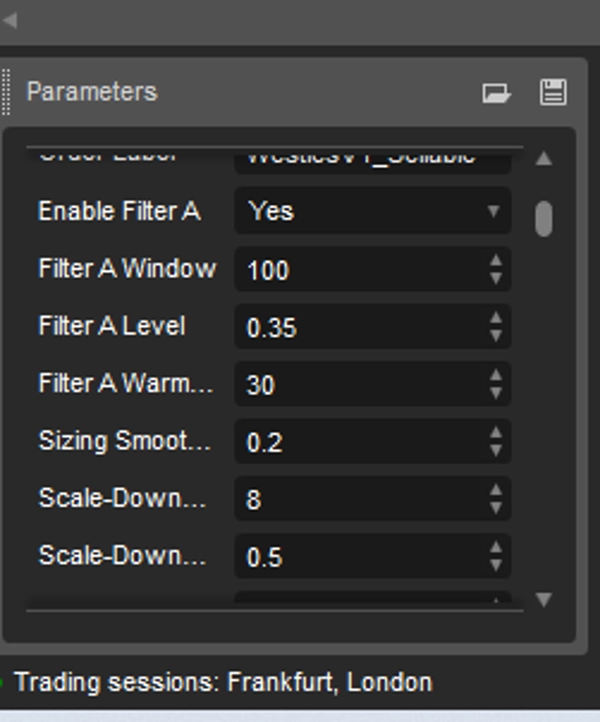
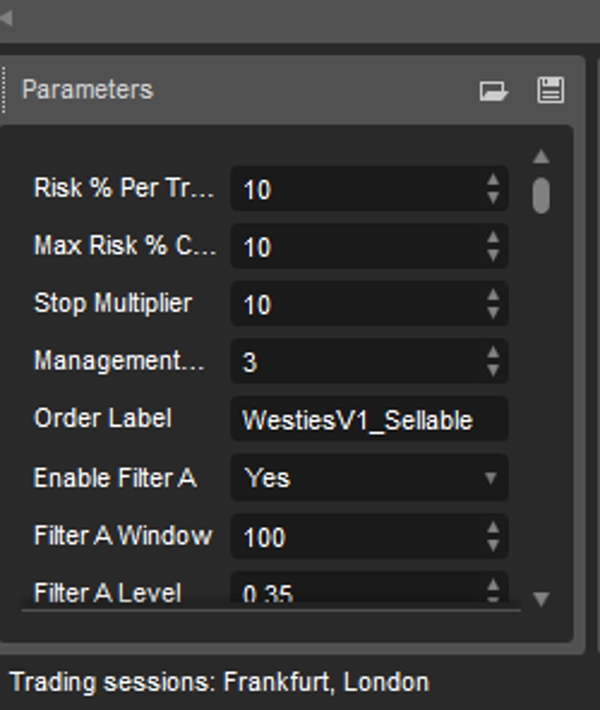
Risiko dikawal oleh dua parameter dalam panel tetapan cBot:
ParameterTujuan
Peratus Risiko Per Dagangan
Dalam tetapan ini anda laraskan. Ia menentukan saiz setiap posisi berbanding baki akaun.
Had Peratus Risiko Maksimum
Had keras. cBot tidak akan pernah menetapkan saiz posisi melebihi angka ini, tidak kira parameter pertama ditetapkan kepada apa.
Untuk mengurangkan saiz posisi, turunkan Peratus Risiko Per Dagangan. Contohnya, menetapkannya kepada 2 menghasilkan keputusan 2% yang ditunjukkan dalam bahagian ujian semula.
Untuk meningkatkan saiz posisi, naikkan Peratus Risiko Per Dagangan. Oleh kerana Had Peratus Risiko Maksimum bertindak sebagai had atas, anda mesti menaikkannya juga jika mahu melebihi nilai semasanya — ini disengajakan supaya angka yang salah taip tidak menghasilkan posisi yang terlalu besar secara senyap.
Tiada tetapan lain perlu diubah. Saiz posisi dikira secara automatik dari baki akaun dan jarak hentian yang ditentukan secara individu untuk setiap dagangan, jadi cBot menyesuaikan saiz lot pada setiap dagangan tanpa konfigurasi lanjut. Mengubah peratusan risiko tidak mengubah dagangan yang diambil; ia hanya mengubah berapa banyak modal yang dilaburkan pada setiap satu.
Satu kesan yang patut difahami: beberapa mekanisme pelindung cBot bertindak balas terhadap pergerakan yang diukur sebagai peratusan baki akaun. Pada saiz posisi yang lebih besar, turun naik pasaran biasa lebih mudah melintasi ambang tersebut, dan posisi mungkin ditutup lebih awal daripada yang dimaksudkan oleh strategi. Ini sebabnya tetapan risiko yang lebih rendah menghasilkan faktor keuntungan yang lebih tinggi dalam ujian.
cBot dihantar dengan Peratus Risiko Per Dagangan ditetapkan kepada 10. Pengguna boleh melaraskan tetapan risiko/pendedahan cBot mengikut saiz akaun dan toleransi risiko individu mereka. Mengubah Peratus Risiko Per Dagangan mempengaruhi saiz posisi dan bukan logik kemasukan asas. Kedua-dua tetapan didokumenkan dalam bahagian ujian semula supaya pilihan boleh dibuat berdasarkan angka.
Pengesanan Rejim Pasaran Adaptif
Strategi mengandungi lapisan penyesuaian rejim khusus.
Daripada bergantung sepenuhnya pada penunjuk konvensional seperti ATR atau ambang kekuatan tren tetap, sistem memantau isyarat statistik yang diperoleh daripada tingkah laku dagangan terkini sendiri. Ia memeriksa bagaimana posisi berkelakuan tidak lama selepas kemasukan dalam tetingkap bergulung.
Apabila tingkah laku yang dipantau merosot berbanding asas terkini, sistem secara automatik mengurangkan pendedahan. Apabila keadaan kembali normal, pendedahan dipulihkan secara automatik.
Ini menjadikan pelarasan risiko berterusan dan membetulkan diri sendiri dan bukannya peraturan bermusim yang diprogram secara manual. Penting, lapisan rejim hanya bertindak balas kepada hasil dagangan yang direalisasikan oleh sistem sendiri, bukan kepada anggaran — jadi ia tidak pernah bertindak berdasarkan andaian.
Pengiraan statistik tepat, ambang dan logik pelarasan adalah proprietari.
Pengurusan Dagangan & Keluar
Strategi tidak menggunakan Take Profit pip tetap konvensional.
Stop Loss. Ditentukan secara dinamik dari struktur harga yang ada pada masa kemasukan dan bukannya jarak pip tetap untuk setiap dagangan.
Take Profit. Tiada sasaran tetap. Posisi diurus melalui gabungan penempatan hentian dinamik, perlindungan keuntungan adaptif dan pengurusan posisi berasaskan masa.
Perlindungan Keuntungan. Sistem tidak mengikut hentian pada setiap tick. Apabila dagangan mencapai keadaan menguntungkan yang ditetapkan, cBot membuat pelarasan pelindung terpilih pada Stop Loss sebenar, mengamankan sebahagian keuntungan yang telah dicapai. Syarat pencetus tepat adalah proprietari.
Masa pegangan maksimum. Posisi boleh kekal terbuka maksimum 8 jam, mengelakkan posisi breakout kekal terdedah tanpa had apabila kesinambungan yang dijangka tidak berlaku.
Keputusan Backtesting
Diuji semula pada data sejarah Pepperstone M1, dengan strategi beroperasi pada jangka masa H1.
Tempoh ujian: 9 Oktober 2025 – 20 Ogos 2026 (~10.4 bulan) Baki awal: $10,000 Isyarat dijana: 159 — di mana 37 (23%) dibatalkan tanpa diisi kerana kesinambungan yang diperlukan tidak berlaku, meninggalkan 122 posisi yang dilaksanakan.
Keputusan ditunjukkan pada dua tetapan risiko. Kedua-dua ujian menggunakan logik strategi yang sama pada tempoh yang sama dan mengambil isyarat yang sama; hanya saiz posisi berbeza.
Risiko 10% — tetapan lalai yang dihantar
Baki akhir
$1,599,604.72
Keuntungan bersih
$1,589,604.72
Pendaraban baki akhir
160×
Faktor keuntungan
Jumlah dagangan
123
Dagangan menang / kalah
67 / 56 (kadar kemenangan 54.5%)
Kehilangan berturut-turut maksimum
4
Purata dagangan
$12,923.61
Dagangan menang terbesar
$283,558.30
Dagangan rugi terbesar
-$175,059.81
Penurunan baki maksimum
Swap bersih
+$5,025.69
Risiko 2%
Baki akhir
$48,797.33
Keuntungan bersih
$38,797.33
Pendaraban baki akhir
4.88×
Faktor keuntungan
Penurunan baki maksimum
Swap bersih
+$47.05
Membandingkan Dua Tetapan
Risiko 2% Risiko 10%
Baki akhir $48,797 $1,599,605
Pendaraban 4.88× 160×
Faktor keuntungan semua dagangan 2.43 2.08
Faktor keuntungan panjang 4.29 3.86
Faktor keuntungan pendek 1.31 1.11
Penurunan baki maksimum 8.82% 28.01%
Tetapan yang lebih tinggi menghasilkan pulangan yang lebih besar. Tetapan yang lebih rendah menghasilkan faktor keuntungan yang lebih tinggi dan penurunan baki yang lebih cetek.
Perbezaan ini adalah struktur dan bukan kebetulan. Beberapa mekanisme pelindung cBot bertindak balas terhadap pergerakan yang diukur sebagai peratusan baki akaun. Pada saiz posisi yang lebih besar, turun naik pasaran biasa lebih mudah melintasi ambang tersebut, dan posisi mungkin ditutup lebih awal daripada yang dimaksudkan oleh strategi. Pada saiz posisi yang lebih kecil, dagangan yang sama dibenarkan berkembang lebih lanjut.
Kedua-dua set angka datang dari logik strategi yang sama mengambil isyarat yang sama dalam tempoh yang sama. Hanya saiz posisi berbeza.
Prestasi Panjang dan Pendek (Ujian Risiko 10%)
DaganganKadar kemenanganFaktor keuntunganKeuntungan bersihBahagian jumlah
Panjang
65
61.5%
$1,489,545.12
93.7%
Pendek
58
46.6%
$100,059.60
6.3%
Dagangan pendek secara keseluruhan menguntungkan, tetapi dengan faktor keuntungan 1.11 mereka hampir seimbang dan menyumbang sebahagian kecil daripada jumlah. Ini didedahkan kerana ia kelihatan dalam statistik dagangan cTrader sendiri dan kerana ia konteks yang relevan: tempoh yang diuji mengandungi bias arah yang kuat dalam Emas, dan keputusan dalam pasaran yang bergerak berbeza mungkin tidak mengikuti corak yang sama.
Komisen dan Kos
Kedua-dua ujian menggunakan spread 1-pip tetap dengan tiada komisen dikenakan. Pedagang pada akaun spread kasar membayar komisen per lot pada XAUUSD, yang merentasi 122 posisi akan mengurangkan hasil. Swap bersih adalah positif dalam kedua-dua ujian, walaupun kadar swap berbeza mengikut broker dan berubah dari masa ke masa.
Pengguna harus menjalankan semula ujian dengan tetapan komisen dan spread broker mereka sendiri untuk melihat hasil yang mencerminkan keadaan dagangan mereka sendiri. Ini adalah pendedahan yang disengajakan: angka utama tidak bersih daripada semua kos dunia sebenar.
Penurunan Baki
Pada tetapan 10%, penurunan baki maksimum adalah 28.01%. Pada tetapan 2% ia turun kepada 8.82%.
Pengedaran Pulangan — Analisis Kepekatan
Sistem momentum biasanya memperoleh sebahagian besar hasil mereka daripada minoriti dagangan. Angka di bawah menunjukkan dengan tepat betapa pekatnya pulangan strategi ini, diukur sebagai bahagian setiap kumpulan daripada jumlah keuntungan kasar.
Pemenang dikeluarkanBahagian keuntungan kasar pada Risiko 1; 10%Bahagian pada Risiko 2; 2%
Teratas 1
9.3%
6.6%
Teratas 3
24.1%
17.8%
Teratas 5.
35.9%
26.5%
Keuntungan dan kerugian kasar untuk tempoh:
Keuntungan kasar
Risiko 10% - $3,034,351
Risiko 2%- $65,415
Kerugian kasar
Risiko 10%- $1,456,811
Risiko 2%- $27,898
Bersih
Risiko 10%- $1,589,604
Risiko 2%- $37,517
Faktor keuntungan
Risiko 10%- 2.08
Risiko 2%- 2.34
Implikasi praktikalnya adalah keputusan sangat bergantung pada menangkap sejumlah kecil pergerakan kesinambungan besar.
Apa Yang Membuat Ini Berbeza
Ini tidak dipersembahkan sebagai strategi emas universal yang direka untuk berfungsi sama dalam setiap persekitaran pasaran. Falsafah pembangunannya adalah sedar rejim.
Emas telah menunjukkan tingkah laku yang sangat berbeza dalam tempoh sejarah yang berbeza. Strategi yang berprestasi baik dalam satu jenis struktur pasaran boleh berkelakuan sangat berbeza apabila volatiliti, kecairan, keadaan makroekonomi dan tingkah laku harga berubah.
Sistem menggabungkan:
Pengesanan breakout tindakan harga proprietari → pengesahan momentum arah → pelaksanaan pesanan tertunda → saiz posisi dinamik → pelarasan risiko berasaskan rejim adaptif → perlindungan keuntungan terpilih → kawalan keluar berasaskan masa
Objektifnya adalah untuk mengambil bahagian secara sistematik dalam pergerakan kesinambungan sebenar sambil mengurangkan pendedahan apabila bukti pasaran terkini sistem menunjukkan keadaan menjadi kurang menguntungkan.
Apa yang cBot ini tidak lakukan: tiada martingale, tiada grid, tiada purata ke dalam posisi rugi, tiada dagangan tanpa stop loss. Setiap posisi membawa hentian pelindung dari saat ia dibuka.
Keperluan Akaun
cBot secara teknikal boleh digunakan pada akaun dari kira-kira $1,500, bergantung pada spesifikasi broker, spesifikasi kontrak simbol, keperluan margin dan tetapan yang dipilih. Untuk operasi praktikal kami mengesyorkan baki permulaan $3,500 atau lebih.
Akaun yang lebih besar tidak menghapuskan risiko dagangan. Pedagang harus memilih pendedahan yang sesuai dengan toleransi risiko dan keadaan akaun mereka sendiri.
Kemas Kini Strategi Berterusan
Strategi ini diselenggara secara aktif. Setiap bulan kami mengkaji prestasi sistem, tingkah laku pasaran dan ciri-ciri XAUUSD yang berkembang untuk mengenal pasti peluang penambahbaikan. Apabila penambahbaikan yang disahkan dikenal pasti, kami mengemas kini cBot supaya pengguna boleh terus menggunakan versi yang diuji terkini.
Kemas kini memberi tumpuan kepada mengekalkan metodologi, kualiti pelaksanaan, pengurusan risiko dan kebolehsuaian sambil mengekalkan prinsip teras yang mana sistem dibangunkan.
Oleh itu, pengguna menerima strategi yang diselenggara secara aktif dan bukannya versi statik sekali sahaja.
Pendedahan Prestasi Penting
Keputusan sejarah di atas dihasilkan menggunakan andaian dan parameter ujian semula yang dinyatakan.
Ujian semula adalah simulasi data pasaran sejarah. Ia boleh berbeza secara material daripada dagangan langsung kerana keadaan pelaksanaan, variasi spread, slippage, kecairan, spesifikasi broker, komisen, swap dan keadaan pasaran.
Keputusan yang ditunjukkan merangkumi satu tempoh ~10 bulan pada satu instrumen, tidak termasuk komisen, dan menganggap spread 1-pip tetap.
Prestasi lalu tidak menjamin keputusan masa depan. Perdagangan XAUUSD melibatkan risiko yang besar, dan kerugian boleh berlaku. Baki akhir sejarah yang ditunjukkan adalah keputusan ujian semula di bawah keadaan yang dinyatakan — bukan pulangan yang dijangka atau dijamin untuk akaun langsung.
Ringkasan
Key features include dynamic, percentage-based position sizing linked to account balance and trade-specific stop distances, with a maximum of three simultaneous positions and a maximum holding time of 8 hours per trade. The system incorporates an adaptive regime-detection layer that adjusts risk exposure based on recent trading outcomes, aiming to reduce exposure when market conditions become less favorable.
Trade management avoids fixed take profits, instead using dynamic stop losses, selective profit protection, and time-based exits. The cBot requires a minimum practical account size of approximately $1,500, with a recommended starting balance of $3,500. Risk per trade is configurable, with backtests shown at 2% and 10% risk settings.
Backtesting on Pepperstone M1 data from October 8, 2025, to September 1, 2026, demonstrated a profit factor above 2.0, a win rate around 54.5%, and maximum drawdowns ranging from 8.82% (2% risk) to 28.01% (10% risk). The strategy is actively maintained with ongoing performance reviews and updates. Users can monitor forward performance via a dedicated Pepperstone cTrader account on Myfxbook.
Ulasan pelanggan
Perbincangan
Soalan Lazim
Lebih banyak produk daripada penulis ini

Anda juga mungkin suka














Harga