Açıklama
ADR Yüksek & Düşük Çizgileri
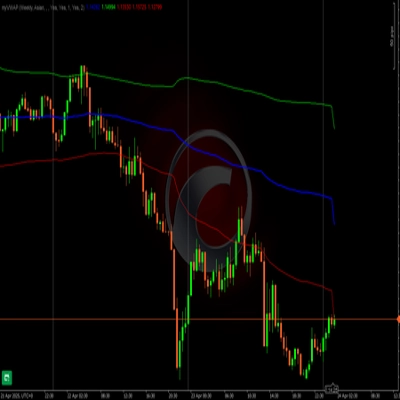
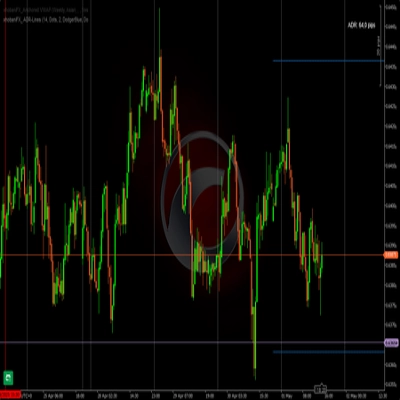
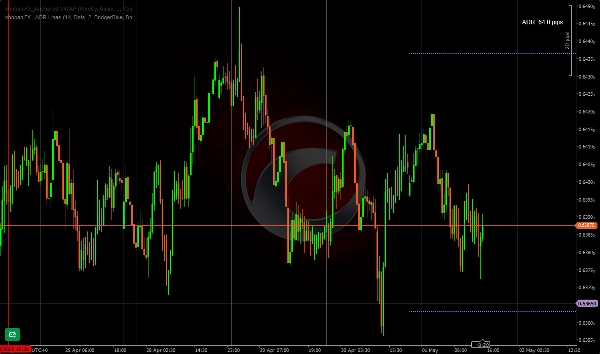
Bu ADR göstergesi, tüccarın tercih ettiği döneme göre mevcut günün düşük/yüksek seviyeleri için yatay çizgiler çizer. Ben 14 günü temel dönem olarak kullanmayı seviyorum ve kullanıyorum. Bu, scalperlar/gün içi tüccarlar için en uygunudur. Böylece bir yüksek/düşük seviyeye ulaşıldığında kolayca fark edebilirsiniz, çizgilerin rengini/stilini/genişliğini istediğiniz farklı bir renge değişecek şekilde seçebilirsiniz.
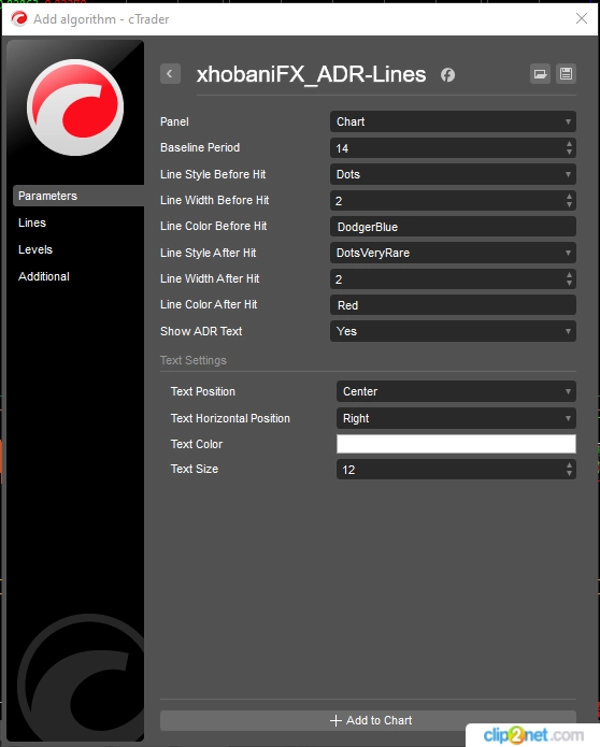
Bu gösterge, tercihlerinizle uyumlu olması ve çalışma alanınız ile renklerinizle hizalanması için parametrelerinin çoğunu özelleştirmenize olanak tanıyacak şekilde geliştirilmiştir.
İyi işlemler!
xhobani_FX
Özet
YZ özeti
xhobaniFX_ADR-Lines is an Average Daily Range (ADR) indicator designed for scalpers and intraday traders. It plots horizontal lines representing the current day's high and low levels based on a user-defined period, with 14 days commonly used as a baseline. The indicator visually highlights when these high or low levels are reached by allowing customization of line color, style, and width to change upon being hit. Most parameters are adjustable to fit individual trading preferences and workspace aesthetics. This tool aids traders in quickly identifying key price levels within the trading day.
Gösterge profili
Müşteri değerlendirmeleri
4.0
Değerlendirmeler: 2
5 | 0 % | |
4 | 100 % | |
3 | 0 % | |
2 | 0 % | |
1 | 0 % |
Tartışma
SSS
cTrader Store üzerinden erişilebilen işlem botları, göstergeler ve eklentiler gibi ürünler, üçüncü taraf sağlayıcılar tarafından sağlanır ve yalnızca bilgilendirme ve teknik erişim amaçlarıyla sunulur. cTrader Store bir broker değildir ve yatırım tavsiyesi, kişisel öneriler vermez veya gelecekteki performansı garanti etmez.