MultiMAIndicator_Optimized
Indikator
1 pembelian
Versi 1.0, Jun 2025
Windows, Mac
4.0
Ulasan: 4
Penerangan
Konfigurasi Pelbagai Penunjuk
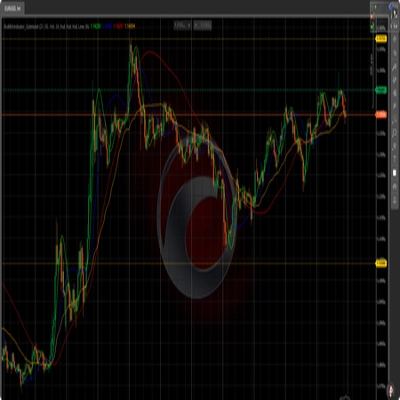
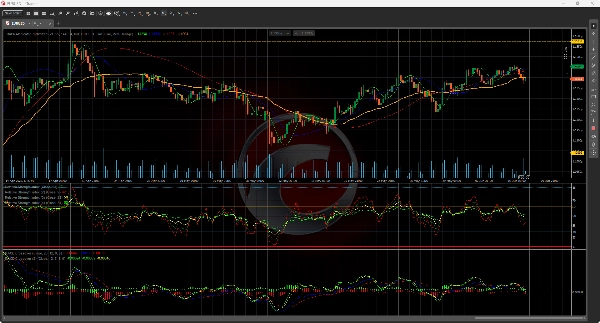
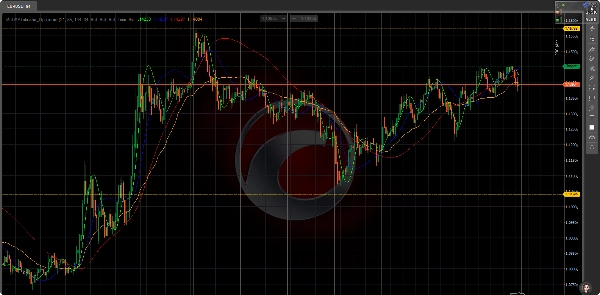
Carta Utama
Memaparkan 3 Purata Pergerakan Hull (HMA) dan 1 Purata Pergerakan Berwajaran Isipadu (VWMA)
Subcarta Pertama
Menunjukkan penunjuk RSI dengan tahap terlebih beli/terlebih jual (ambang 70/30)
Subcarta Kedua
Memaparkan penunjuk MACD termasuk garis isyarat dan histogram
Istilah Utama
Purata Pergerakan Hull (HMA):
Purata pergerakan maju yang mengurangkan kelewatan melalui pengiraan harga berwajaran
Purata Pergerakan Berwajaran Isipadu (VWMA):
Penunjuk pengesahan harga yang diberi wajaran oleh isipadu dagangan
Tahap Terlebih Beli/Terlebih Jual:
Ambang RSI standard (70 = Terlebih Beli, 30 = Terlebih Jual)
Histogram MACD:
Perwakilan visual perbezaan/penyatuan momentum
Ringkasan
Profil indikator
Ulasan pelanggan
4.0
Ulasan: 4
5 | 25 % | |
4 | 50 % | |
3 | 25 % | |
2 | 0 % | |
1 | 0 % |
Ulasan pelanggan
June 23, 2025
pretty decent as a helper. Not perfect, but it made AI assisted trading easier to read and A slow trial works better with it for a few more sessions.
June 22, 2025
tested like a normal trader would, small size first. The idea is fine, but it is not worth trying to scale it before seeing how it handles bad days. Manual review still matters here.
June 21, 2025
This fits AI assisted trading better as a review layer. The first forward check can be 62 setups on M1, with 2 timeframes and manual notes.
June 17, 2025
feels right for a user who wants less noise in the process. The best use is checking market bias, then leaving the final filter manual. Better rechecked it on 30 days.
Perbincangan
Soalan Lazim
Signal
RSI
MACD
Produk yang tersedia melalui cTrader Store, termasuk bot dagangan, indikator dan plugin, disediakan oleh pembangun pihak ketiga dan diberikan akses untuk tujuan maklumat dan teknikal sahaja. cTrader Store bukan broker dan tidak memberikan nasihat pelaburan, syor peribadi atau sebarang jaminan prestasi masa hadapan.
Anda juga mungkin suka


Harga
Sejak 03/04/2025
1.71B
Volum yang didagangkan
556.96K
Pip dimenangi
1
Jualan