
Penerangan
RiskLotSizer adalah penunjuk pengurusan risiko dan saiz posisi berasaskan carta untuk cTrader, direka untuk membantu pedagang mengira saiz dagangan yang sesuai dengan cepat dan secara visual.
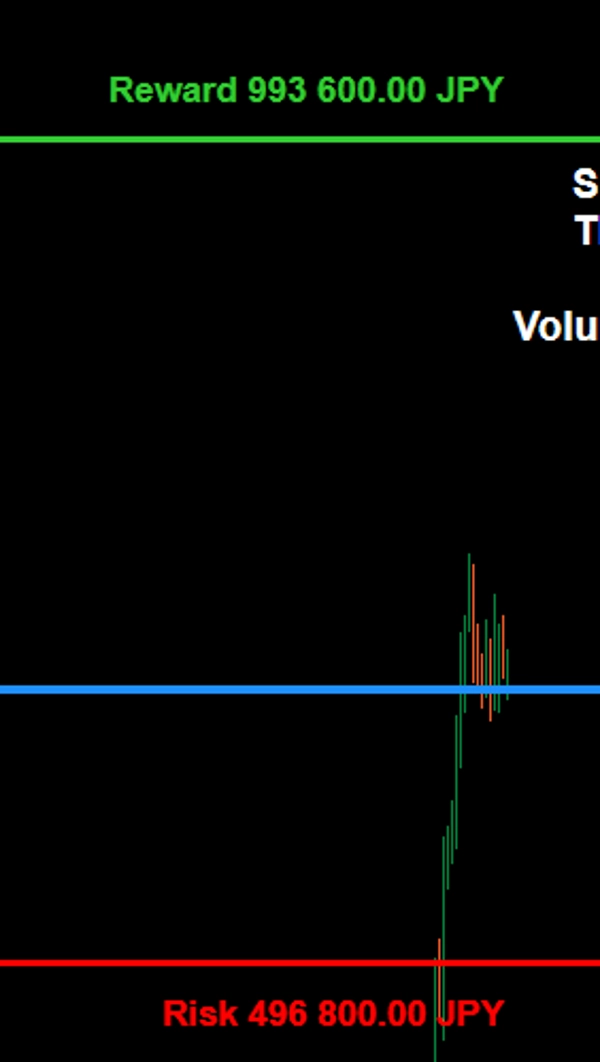
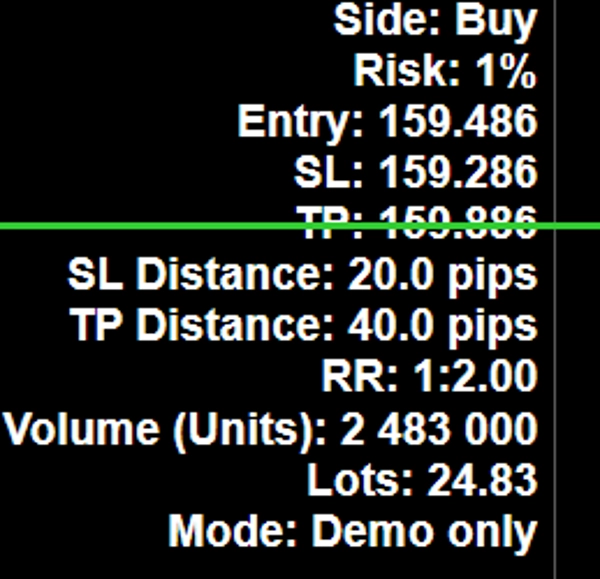
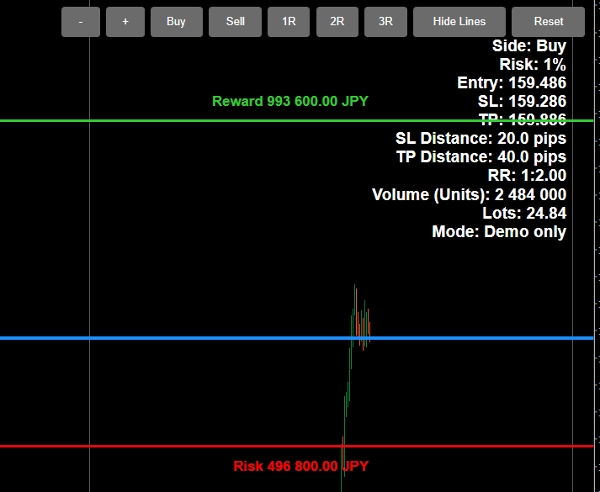
Penunjuk ini membolehkan anda melaraskan tahap Entry, Stop Loss, dan Take Profit terus pada carta, menjadikannya lebih mudah untuk merancang dagangan secara masa nyata. Berdasarkan peratusan risiko ekuiti akaun yang anda pilih, RiskLotSizer secara automatik mengira saiz posisi dan memaparkan anggaran saiz lot, jumlah risiko, jumlah ganjaran, dan nisbah risiko/ganjaran.
Ia menyokong kedua-dua senario Beli dan Jual dan direka untuk memberikan pedagang gambaran visual yang jelas mengenai risiko dagangan sebelum memasuki posisi. Nilai risiko dan ganjaran dipaparkan terus berhampiran garis SL dan TP, manakala panel maklumat utama menyediakan ringkasan yang kemas mengenai tetapan tersebut.
Ciri-ciri utama termasuk:
- Pengiraan saiz lot berdasarkan peratusan ekuiti yang dipilih
- Garis Entry, SL, dan TP yang boleh disesuaikan terus pada carta
- Paparan masa nyata saiz posisi, jumlah risiko, jumlah ganjaran, dan RR
- Sokongan untuk kedua-dua mod Beli dan Jual
- Butang pratetap RR pantas untuk perancangan dagangan yang lebih cepat
- Sokongan bahasa Inggeris dan Jepun
- Togol keterlihatan garis untuk carta yang lebih kemas apabila diperlukan
RiskLotSizer sesuai untuk pedagang budi bicara, pedagang harian, dan sesiapa sahaja yang mahukan cara yang lebih pantas dan jelas untuk menentukan saiz posisi sambil mengekalkan kawalan risiko yang konsisten.
RiskLotSizer は、チャート上で直感的にポジションサイズを計算できる cTrader 用のポジションサイジング・リスク管理インジケーターです。
Entry、Stop Loss、Take Profit の各ラインをチャート上で直接動かしながら、指定した有効証拠金比率に基づく適正ロット数を自動計算します。これにより、トレード前に必要なロット数、想定損失額、想定利益額、Risk/Reward をリアルタイムで把握できます。
Buy / Sell の両方に対応しており、RR プリセットボタンによって利確目標の調整も素早く行えます。また、SL・TP 付近には損失額・利益額が表示されるため、視覚的にも分かりやすく、実践的なトレード設計をサポートします。
主な特長:
- 有効証拠金に対する指定リスク率からロット数を自動計算
- Entry / SL / TP をチャート上で直接調整可能
- ロット数、損失額、利益額、RR をリアルタイム表示
- Buy / Sell の両方に対応
- RR プリセットボタン搭載
- 英語 / 日本語切替対応
- 必要に応じてライン表示の ON / OFF が可能
RiskLotSizer は、裁量トレーダー、デイトレーダー、そして一貫したリスク管理を重視するトレーダーに適したインジケーターです。
Ringkasan
Ulasan pelanggan
5 | 0 % | |
4 | 100 % | |
3 | 0 % | |
2 | 0 % | |
1 | 0 % |