Descrição
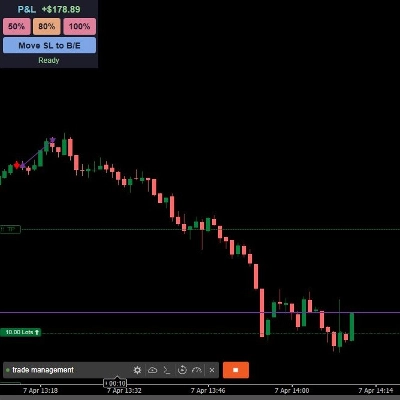
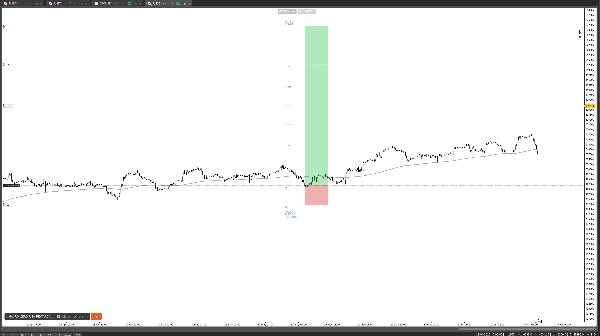
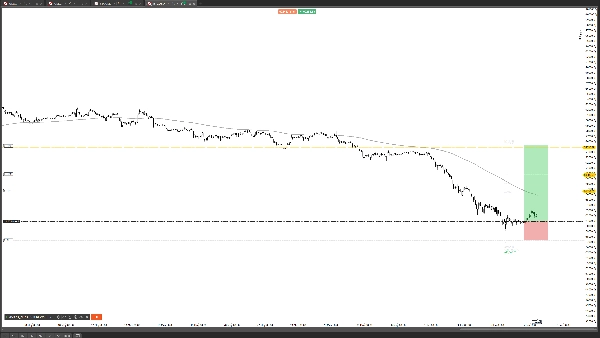
O QUE ELE FAZ Desenha uma caixa visual de risco/recompensa para cada posição ativa, ordem pendente e negociação histórica no seu símbolo — tudo em tempo real. O cBot lê automaticamente o preço de entrada, stop loss e take profit e renderiza retângulos preenchidos com cores mostrando sua zona de SL e zona de TP lado a lado, para que você veja sua exposição ao risco de relance, sem cálculos manuais.
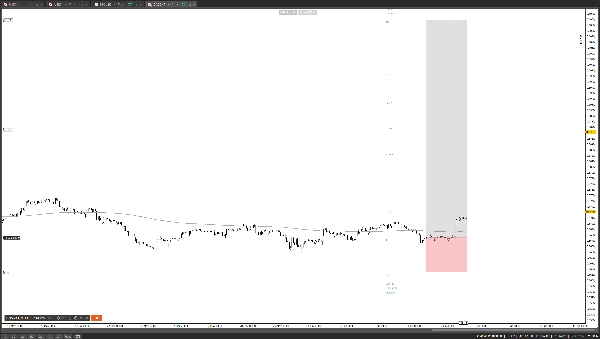
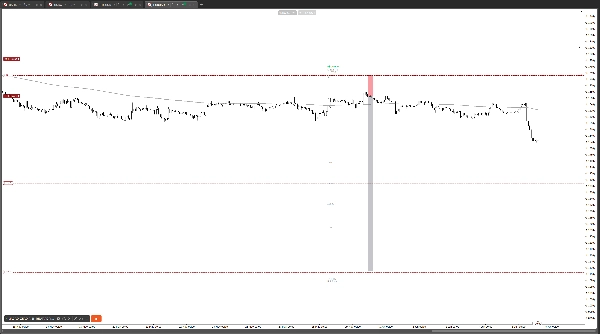
POSIÇÕES ATIVAS & ORDENS PENDENTES Cada posição aberta e ordem pendente com SL e TP configurados é desenhada automaticamente. A caixa atualiza ao vivo a cada 5 segundos ou imediatamente sempre que uma posição é aberta, modificada ou fechada. Ordens pendentes podem ser ativadas ou desativadas via parâmetro — desative-as se quiser acompanhar apenas negociações ao vivo.
ETIQUETAS DE PREÇO & MEDIÇÕES Cada caixa exibe: seta de entrada, níveis de preço SL e TP, distância em pips da entrada ao SL, razão R:R (ex. 1:2.50), e o P&L líquido atual em dólares — codificado por cores em verde para lucro e vermelho para perda. Todas as etiquetas podem ser ativadas ou desativadas independentemente.
RÉGUA DE PREÇO Uma régua opcional sobrepõe a zona de TP em níveis de referência chave para que você possa identificar alvos parciais de take profit e áreas de confluência de preço sem trocar de ferramenta.
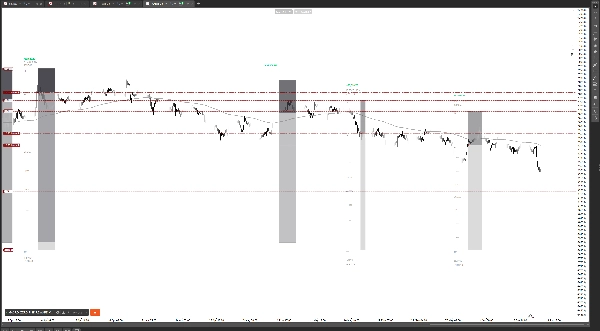
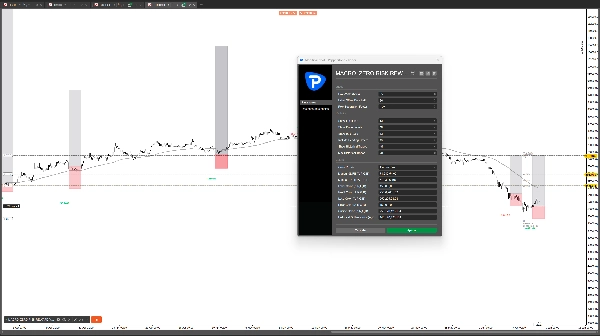
NEGOCIAÇÕES HISTÓRICAS Ative o modo histórico para exibir até 200 negociações fechadas. O cBot associa cada negociação fechada ao seu SL/TP original usando o ID da posição e proximidade do tempo de preenchimento, e desenha uma versão esmaecida da caixa com o resultado final do P&L — fornecendo um histórico visual de todos os seus setups executados diretamente no gráfico.
PERFIS DE COR Escolha entre 4 perfis de cor embutidos — Clássico (Vermelho/Verde), CinzaEscuro, RosaAtual, ou Manual — onde você define cada cor ARGB individualmente: preenchimento SL, preenchimento TP, etiquetas, P&L, régua e contorno. As cores atualizam ao vivo quando os parâmetros são alterados, sem necessidade de reiniciar.
NOTAS TÉCNICAS Construído como um cBot para cTrader para máxima estabilidade — mantém o estado visual entre reconexões e responde a todos os eventos de posição em tempo real. Não executa nenhuma negociação. Requer a plataforma cTrader com SL e TP configurados nas suas posições.
⚠️ Aviso de Risco: Negociar instrumentos financeiros envolve risco significativo de perda e pode não ser adequado para todos os investidores. Desempenho passado não indica resultados futuros. Esta ferramenta é projetada apenas para visualização e monitoramento e não constitui aconselhamento financeiro. Sempre negocie com responsabilidade e apenas com capital que você pode perder.
Resumo
Key features include:
- Visualization of all open positions and pending orders with configured SL and TP, with an option to toggle pending orders.
- Display of entry arrows, SL and TP price levels, pip distances, risk-to-reward ratios, and current net profit or loss in dollars, with customizable label visibility.
- An optional price ruler overlaying the TP zone to highlight partial take profit targets and price confluence areas.
- Historical mode showing up to 200 closed trades with dimmed boxes indicating final P&L results.
- Four built-in color profiles and a manual mode for full color customization of all visual elements.
The cBot maintains visual state across reconnections and reacts in real time to position events. It does not execute trades and requires positions to have SL and TP configured.