
Descripción
Este no es solo otro robot RSI con configuraciones aleatorias y pruebas retrospectivas sobreajustadas.
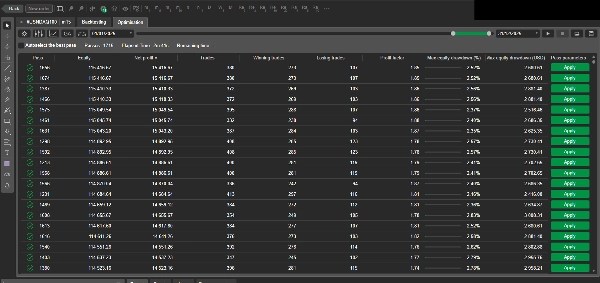
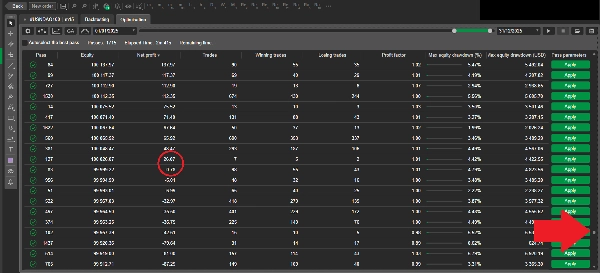
Cuando compras este cBot, también recibes un paquete completo de análisis, construido a partir de pruebas cuantitativas a gran escala. Más de 1 millón de combinaciones de parámetros probadas en gráficos Japanese/Heiken Ashi/Renko
Cómo funciona la estrategia
Entrada larga
- Se activa una señal larga cuando el RSI cruza hacia arriba a través de un nivel definido:
(Ejemplo: El nivel RSI era 29. Ahora es 31. Cruza el nivel 30 hacia arriba. Aquí el cBot abre una posición larga)
Salida larga
- Toma de ganancias (TP) — salida por cruce inverso
Salida cuando el RSI cruza hacia abajo por debajo del nivel TP. Ejemplo: El nivel RSI era 71. Ahora es 69. Cruza el nivel 70 hacia abajo. Aquí el cBot cierra la posición larga.
- Salida protectora — salida por cruce inverso (solo si la operación está en ganancia)
Salida cuando el RSI cruza hacia abajo por debajo del nivel de protección, pero solo si la posición está actualmente en ganancia.
- Stop Loss (SL) — parada en nivel RSI (no se requiere cruce)
Salida inmediata si el nivel RSI toca el SL. Ejemplo: Entrar en posición larga en nivel RSI 30, SL es 25. Cuando el RSI toca 25, la posición larga se cerrará.
Lo contrario para la posición corta
Gestión de posiciones
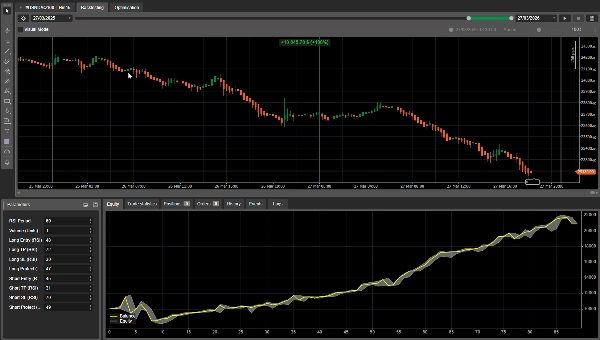
- El robot mantiene solo una posición a la vez por símbolo.
Temporización de señales
- Las señales se evalúan solo después de que una barra se cierra.
- Si aparece una señal, la entrada se ejecuta en la APERTURA de la siguiente barra (sin conjeturas intrabar y podemos evaluar correctamente la estrategia).
Cómo valido las configuraciones
No “escojo parámetros a ojo” ni valores aleatorios. Pruebo grandes espacios de parámetros usando un algoritmo genético (GA):
- Miles de combinaciones de parámetros se evalúan automáticamente
- La selección mantiene diversidad, no solo los mejores rendimientos (para reducir el riesgo de sobreoptimización)
- Las pruebas se realizan en múltiples periodos, marcos temporales y tipos de gráficos (Japanese / Heiken Ashi / Renko)
Esto produce un gran conjunto de datos de resultados y ayuda a identificar regiones estables de parámetros, no solo una configuración afortunada. Después de la primera pasada del GA, ejecuto una segunda etapa de optimización enfocada en las regiones de parámetros más estables y rentables.
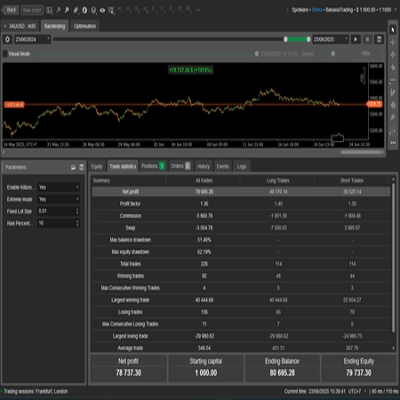
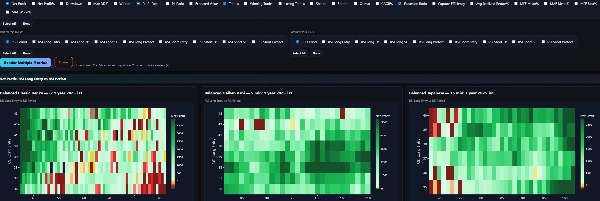
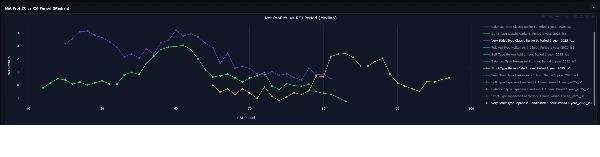
Métricas (lista breve)
En el análisis rastreo, entre otros:
- Beneficio neto, Máxima caída
- Factor de beneficio, Tasa de aciertos, Valor esperado
- Sharpe, Sortino, Calmar
- MAE / MFE (excursiones)
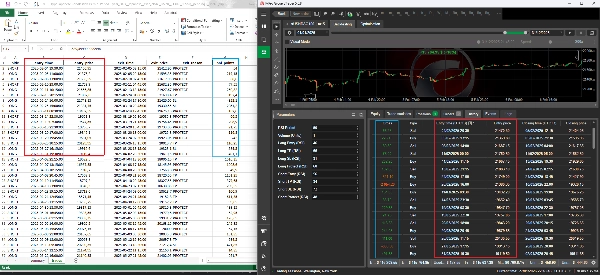
Mis resultados GA y las pruebas retrospectivas de cTrader pueden diferir ligeramente (y es normal)
Cuando comparas mis resultados de optimización genética (GA) con una prueba retrospectiva de cTrader, puedes notar pequeñas diferencias en ganancias, precio de entrada/salida o algunas métricas derivadas.
Estas diferencias son esperadas y provienen de dos factores controlados:
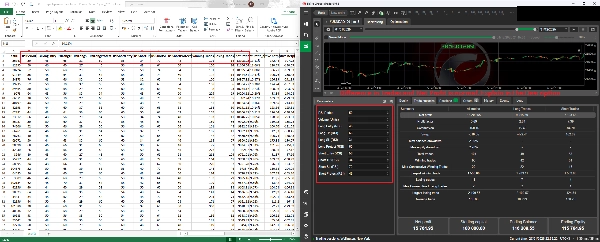
1) Cierre forzado de posición al final de la prueba (sin “operaciones abiertas”)
Mi motor GA siempre cierra cualquier posición abierta en la barra final de la ventana de prueba. Esto previene posiciones “atascadas” o flotantes y hace que los resultados sean completamente realizados y comparables entre ejecuciones.
En cTrader, dependiendo de la configuración, una prueba retrospectiva puede:
- dejar una posición abierta al final, o
- cerrarla de manera diferente (tiempo/precio), o
- manejar la ejecución de la barra final con mecánicas ligeramente diferentes.
Eso por sí solo puede crear una pequeña diferencia en el capital/ganancia final.
2) Efectos de spread/deslizamiento durante picos de volatilidad
Los mercados reales (y simulaciones realistas) pueden mostrar picos ocasionales de volatilidad, donde:
- los spreads se amplían,
- el deslizamiento aumenta,
- los precios de ejecución difieren ligeramente.
Mi modelo GA incluye spread + deslizamiento opcional + comisión, y en segmentos de alta volatilidad raros esto puede desplazar las ejecuciones ligeramente. Incluso un pequeño cambio de precio puede modificar ligeramente métricas como beneficio neto, caída, factor de beneficio y otras
A pesar de estas pequeñas diferencias a nivel de ejecución, el comportamiento y los resultados de la estrategia son directamente comparables:
- las entradas/salidas siguen la misma lógica,
- las operaciones ocurren en las mismas áreas,
- y las métricas clave de rendimiento permanecen alineadas.
Si deseas:
- paquete completo de análisis (T + panel interactivo),
- configuraciones recomendadas para tu activo/marco temporal,
- o investigación personalizada / desarrollo de estrategia,
Contáctame a través de un enlace en mi perfil para recibir Análisis
Aviso de riesgo: Este robot es para fines educativos y de investigación. El trading implica riesgos, y el rendimiento pasado no garantiza resultados futuros.
Resumen
The robot manages one position per symbol at a time and evaluates signals only after bar close, executing trades at the next bar's open to avoid intrabar uncertainty. Parameter settings are optimized through extensive genetic algorithm testing, evaluating over one million parameter combinations across multiple periods, timeframes, and chart types to identify stable and profitable configurations. The package includes a full analytics suite tracking metrics such as net profit, max drawdown, profit factor, Sharpe ratio, and more.
Backtests use 100:1 leverage and market orders, with risk management via fixed lot sizing, take profit, and stop loss tools. Recommended minimum balance is $10,000 with 1% risk per trade and a maximum drawdown of 26.5%. The strategy targets low-frequency trades on instruments including BTCUSD, XAUUSD, NAS100, and indices.
Valoraciones de clientes
5 | 0 % | |
4 | 100 % | |
3 | 0 % | |
2 | 0 % | |
1 | 0 % |