
Nassimi Take Profit
cBot
447 transferências
Versão 1.0, Jan 2025
Windows, Mac, Mobile, Web
5.0
Avaliações: 1
Descrição
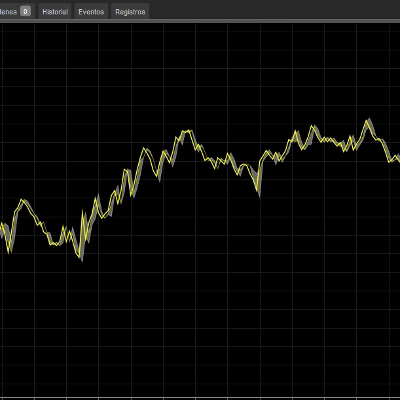
Esta ilustração digital visualiza um gráfico de negociação com foco no robô Nassimi Take Profit. O gráfico exibe um padrão de engolfo de alta com barras verdes para movimento ascendente e um padrão de engolfo de baixa com barras vermelhas para movimento descendente. O robô de negociação é simbolizado por uma interface de sistema automatizado elegante e futurista, cercada por gráficos, linhas e vários indicadores financeiros. Além disso, a imagem incorpora elementos-chave de gestão de risco, como níveis de stop loss e take profit, que são representados como linhas no gráfico. O estilo geral é moderno, limpo e inspirado em tecnologia, criando uma representação profissional e visualmente atraente da negociação automatizada.
Resumo
Resumo de IA
Nassimi Take Profit is an automated trading robot designed to operate on financial charts featuring bullish and bearish engulfing patterns. The system visually represents upward price movements with green bars and downward movements with red bars. It integrates key risk management tools, including stop loss and take profit levels, which are displayed as lines on the trading chart. The robot’s interface is modern and tech-inspired, incorporating various financial indicators and graphical elements to support automated trading decisions. This product focuses on visualizing and executing trades based on price action patterns within a clean, professional framework.
Perfil de negociação
Avaliações de clientes
5.0
Avaliações: 1
5 | 100 % | |
4 | 0 % | |
3 | 0 % | |
2 | 0 % | |
1 | 0 % |
Avaliações de clientes
November 20, 2025
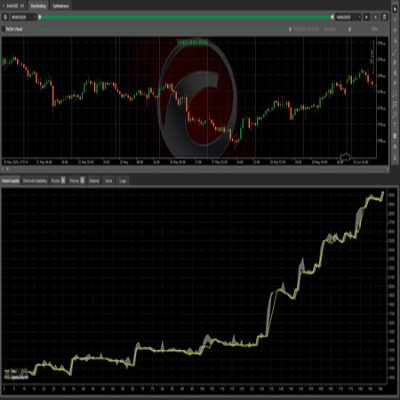
Nassimi Take Profit is a clean utility tool for managing TP levels. It doesn’t open trades, so all test results stay at zero - which is expected. In live-mode it performs flawlessly: assigns TP, updates it, and handles multiple orders reliably. A solid add-on for manual traders, but not a strategy for ROI testing.
Conversa
Perguntas frequentes
Os produtos disponíveis através da cTrader Store, incluindo bots de negociação, indicadores e plugins, são fornecidos por programadores terceiros e são disponibilizados apenas para fins informativos e de acesso técnico. A cTrader Store não é um corretor e não fornece aconselhamento em matéria de investimento, recomendações pessoais ou qualquer garantia de desempenho no futuro.
Mais deste autor


Preço
Desde 14/01/2025
958
Instalações gratuitas