

R3.Alpha Analytics
إضافة متعددة المنصات
423 التنزيلات
الإصدار 1.0، Sep 2026
Windows, Mac, Mobile, Web
5.0
التقييمات: 10

44.34M
حجم التداول
45.33K
الربح بالبيب
423
التثبيتات المجانية
الوصف
R3.Alpha Analytics تحول تاريخ تداولك في cTrader إلى تقرير أداء ومخاطر بمستوى مؤسسي — تلقائيًا، بدون إدخال يدوي. يقرأ صفقاتك المغلقة ويحسب مجموعة كاملة من المقاييس الكمية عبر عشرة علامات تبويب:
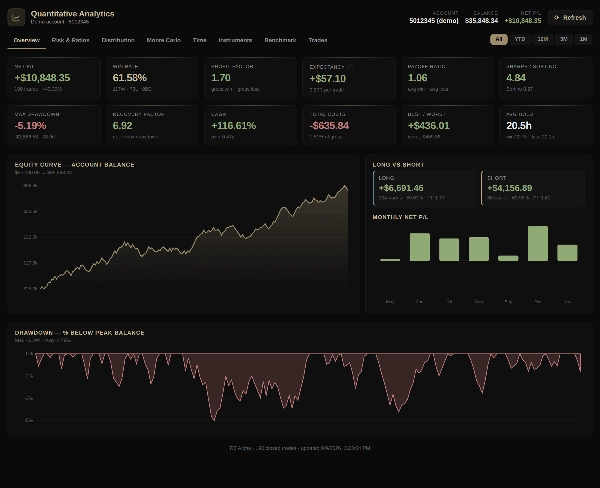
- نظرة عامة — صافي الربح/الخسارة، نسبة العائد الإجمالي، متوسط العائد الشهري، معدل الفوز، عامل الربح، التوقع، معدل النمو السنوي المركب، أقصى تراجع، منحنى الأسهم وتقسيم المراكز الطويلة مقابل القصيرة.
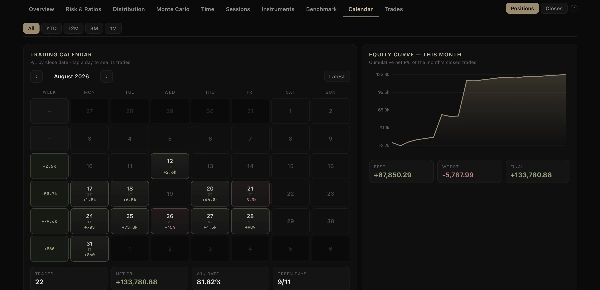
- التقويم — تقويم تداول يومي للربح/الخسارة مع إجماليات أسبوعية، عرض يومي قابل للفتح بالنقر، ونظرة عامة على السنة كاملة.
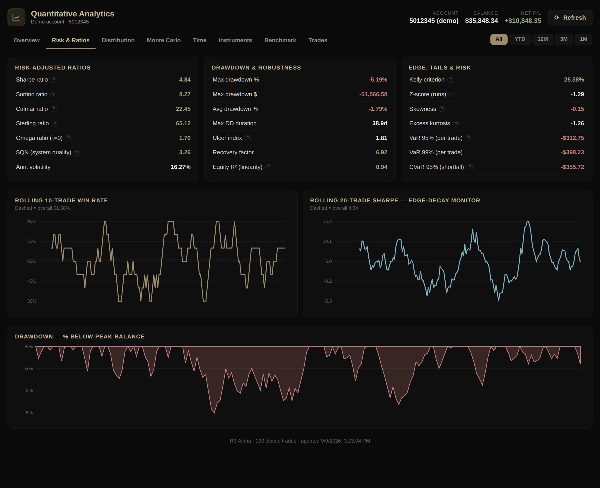
- المخاطر والنسب — شارب، سورتينو، كالمار، ستيرلينغ، أوميغا، SQN، VaR/CVaR، مؤشر القرحة، عامل التعافي، معدل الفوز المتداول وشارب المتداول.
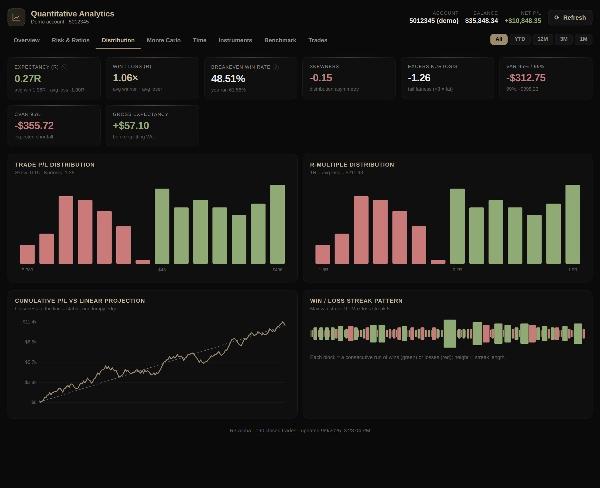
- التوزيع — مضاعفات R، الانحراف، التفلطح، مخطط الربح/الخسارة، وسلاسل الفوز/الخسارة.
- مونتي كارلو — خطر الفشل، احتمال الربح، التراجعات المحاكاة ونسب الأسهم المئوية.
- الزمن — الأداء حسب يوم الأسبوع، الساعة، الشهر ومدة الاحتفاظ.
- الجلسات — آسيا، لندن، تداخل لندن–نيويورك ونيويورك مقارنة بالقوة والجودة، مع أفضل الأزواج أداءً في كل جلسة.
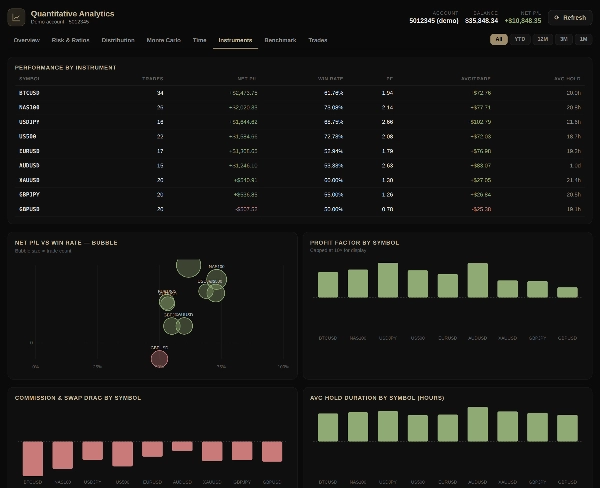
- الأدوات — النتائج، عامل الربح، التكاليف ومدة الاحتفاظ لكل رمز.
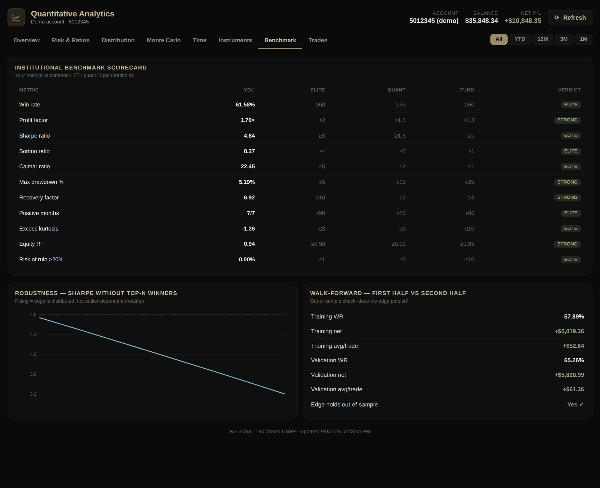
- المعيار المرجعي — بطاقة تقييم مقابل عتبات التداول عالي التردد، الكمي والصناديق، مع التحقق المتقدم.
- الصفقات — سجل الصفقات الكامل مع أسعار الدخول والخروج، مدة الاحتفاظ، المبادلات والعمولات.
كل رسم بياني تفاعلي. تقوم فلاتر الفترة (الكل، منذ بداية السنة، 12 شهرًا، 3 أشهر، شهر واحد) بإعادة حساب كل مقياس على حدود التقويم، ومفتاح التبديل بين المراكز / الإغلاقات يتيح لك عد كل مركز كصفقة واحدة أو مطابقة إحصائيات cTrader الخاصة، حيث كل إغلاق جزئي هو صفقة منفصلة. الإضافة للقراءة فقط ولا تقوم بوضع صفقات أبدًا. استخدمها لتدقيق ميزتك، مراقبة التراجع والاتساق، ورؤية كيف يعمل نظامك بالضبط.
الملخص
AI summary
R3.Alpha Analytics is a web plugin designed for cTrader accounts that automatically generates institutional-grade performance and risk reports from your closed trade history. It provides a comprehensive quantitative analysis across eight interactive tabs, including:
1. Overview: net profit/loss, win rate, profit factor, expectancy, CAGR, and drawdown.
2. Risk & Ratios: metrics such as Sharpe, Sortino, Calmar, Sterling, Omega, SQN, VaR/CVaR, Ulcer index, and recovery factor.
3. Distribution: analysis of R-multiples, skewness, kurtosis, and profit/loss histograms.
4. Monte Carlo simulations: risk of ruin, probability of profit, and equity percentiles.
5. Time and instrument breakdowns.
6. Benchmark scorecard: compares performance against high-frequency trading, quantitative, and fund thresholds with walk-forward validation.
7. Full trade log.
All charts are interactive with period filters that dynamically update metrics. The plugin operates in read-only mode and does not place trades. It is intended for auditing trading edge, monitoring drawdowns and consistency, and detailed system performance evaluation.
1. Overview: net profit/loss, win rate, profit factor, expectancy, CAGR, and drawdown.
2. Risk & Ratios: metrics such as Sharpe, Sortino, Calmar, Sterling, Omega, SQN, VaR/CVaR, Ulcer index, and recovery factor.
3. Distribution: analysis of R-multiples, skewness, kurtosis, and profit/loss histograms.
4. Monte Carlo simulations: risk of ruin, probability of profit, and equity percentiles.
5. Time and instrument breakdowns.
6. Benchmark scorecard: compares performance against high-frequency trading, quantitative, and fund thresholds with walk-forward validation.
7. Full trade log.
All charts are interactive with period filters that dynamically update metrics. The plugin operates in read-only mode and does not place trades. It is intended for auditing trading edge, monitoring drawdowns and consistency, and detailed system performance evaluation.
ملف تعريف الإضافة
فئة الإضافات
التحليلات
الوصول إلى البيانات
المراكز
التاريخ
الأوامر
حساب
تقييمات العملاء
5.0
التقييمات: 10
5 | 100 % | |
4 | 0 % | |
3 | 0 % | |
2 | 0 % | |
1 | 0 % |
تقييمات العملاء
September 30, 2026
September 30, 2026
I like that the statistics here don't just look like a bunch of numbers. This one can actually be used to analyze trading
September 28, 2026
September 28, 2026

September 25, 2026
I've used several similar tools I particularly liked the detailed trading history

September 25, 2026
After connecting, I immediately discovered several things in my trading that I hadn't noticed before, thank you

September 21, 2026
مناقشة
الأسئلة الشائعة
Risk/Reward
Risk/Reward
Trade Journal
Trade Statistics
يتم توفير المنتجات المتاحة من خلال cTrader Store، بما في ذلك روبوتات التداول والمؤشرات والإضافات، من قبل مطوري الطرف الثالث وإتاحتها لأغراض الوصول المعلوماتي والفني فقط. cTrader Store ليس وسيطًا ولا يقدم نصائح استثمارية أو توصيات شخصية أو أي ضمان للأداء المستقبلي.

















السعر
44.34M
حجم التداول
45.33K
الربح بالبيب
423
التثبيتات المجانية