MultiTimeframe Pivot Levels Pro
Индикатор
Версия 1.0, Nov 2025
Windows, Mac
Описание
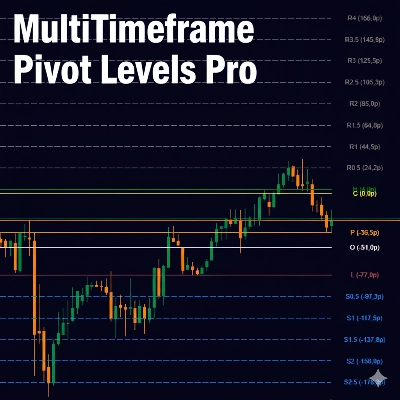
MultiTimeframe Pivot Levels Pro — это продвинутый торговый индикатор, который отображает точки разворота и уровни поддержки/сопротивления с более высоких таймфреймов прямо на вашем текущем графике. Этот мощный инструмент помогает трейдерам выявлять ключевые ценовые уровни для стратегических точек входа и выхода.
Основные функции:
- Мульти-таймфреймный анализ (отображение дневных, недельных, месячных точек разворота на любом графике)
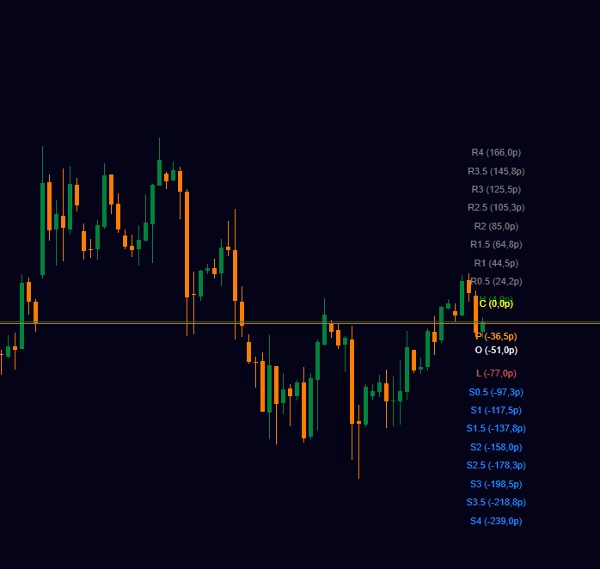
- 8 уровней поддержки и 8 уровней сопротивления для комплексного анализа рыночной структуры
- Два метода расчёта точек разворота (Классический: H+L/2, Стандартный: H+L+C/3)
- Настраиваемые цвета и видимость для всех уровней
- Отображение расстояния в пипсах от текущей цены
- Оптимизированная производительность для плавной работы
- Чистое, профессиональное визуальное оформление
Идеально подходит для:
- Свинг-трейдеров, использующих несколько таймфреймов
- Дейтрейдеров, которым нужны ключевые уровни для ориентира
- Трейдеров, работающих с ценовым действием и определяющих поддержку/сопротивление
- Всех стилей торговли, стремящихся к точной торговле на основе уровней
Сводка
Профиль индикатора
Отзывы покупателей
0.0
Отзывы: 0
Отзывы покупателей
У этого продукта еще нет отзывов. Уже попробовали его? Поделитесь впечатлениями!
Обсуждение
Частые вопросы
BTCUSD
Forex
Indices
EURUSD
Commodities
GBPUSD
NZDUSD
Crypto
Stocks
XAUUSD
NAS100
USDJPY
Продукты, доступные в cTrader Store, включая торговых ботов, индикаторы и плагины, предоставляются сторонними разработчиками и доступны исключительно в информационных и технических целях. cTrader Store не является брокером и не предоставляет инвестиционные консультации, персональные рекомендации или какие-либо гарантии будущей доходности.
Больше от этого автора


Цена
С 28/12/2024
54
Бесплатные установки