Описание
PROPFOLIO MASTER SUITE: РУКОВОДСТВО ПО ИСПОЛЬЗОВАНИЮ
Платформа: cTrader Версия: 1.0 (Store-Compliant Edition) Разработано: Propfolio Solutions
Добро пожаловать в Панель управления PropFolio Peak Formation SMC. Это полный институциональный набор графических инструментов, предназначенный для объединения концепций Smart Money Concepts (SMC), отслеживания Beat The Market Maker (BTMM) и анализа Volume Profile в одном легком и высоко оптимизированном индикаторе cTrader.
📥 1. РУКОВОДСТВО ПО УСТАНОВКЕ
- Скачайте файл
PropFolioPeakFormationSMCDashbaord.algo. - Дважды щелкните по файлу
.algo. cTrader автоматически откроется и установит его. - Откройте любой график в cTrader.
- Щелкните правой кнопкой мыши по графику -> Индикаторы -> Пользовательские -> Выберите PropFolioPeakFormationSMCDashbaord.
- Нажмите OK для применения.
📊 2. ОБЪЯСНЕНИЕ ПАНЕЛИ УПРАВЛЕНИЯ
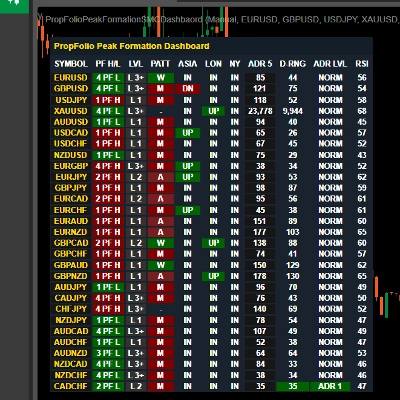
Набор включает многосимвольную панель, которая отслеживает институциональные рыночные состояния в реальном времени по 11 столбцам.
- СИМВОЛ: Отслеживаемая валютная пара. Вы можете задать собственный список в настройках индикатора.
- PF H/L (Пиковая формация): Показывает, находится ли текущий 5-дневный цикл в Пиковой Форме Высокого (PFH) или Пиковой Форме Низкого (PFL), и сколько дней назад она сформировалась.
- LVL (Уровень): Текущий уровень цикла BTMM (Уровень 1, Уровень 2 или Уровень 3+).
- PATT (Шаблон): Определяет внутридневные институциональные шаблоны.
-
- M / W: Стандартные формы M и W.
- A / V: A-вершины и V-низины.
- ASIA / LON / NY: Показывает текущее состояние цены относительно диапазона конкретной сессии.
-
- UP (Зеленый): Цена пробила выше максимума сессии.
- DN (Красный): Цена пробила ниже минимума сессии.
- IN (Серый): Цена находится в диапазоне внутри сессионного бокса.
- ADR 5: Средний дневной диапазон за последние 5 дней (в пунктах).
- D-RNG: Текущий дневной диапазон (в пунктах).
- ADR LVL: Показывает, исчерпал ли текущий день свой ADR.
-
- NORM: Нормальный диапазон.
- ADR 1 / 2 / 3: Цена преодолела 1x, 2x или 3x свой нормальный дневной объем (Ожидайте истощения/разворотов).
- RSI: 15-минутный RSI для быстрого определения перекупленности (красный) или перепроданности (зеленый).
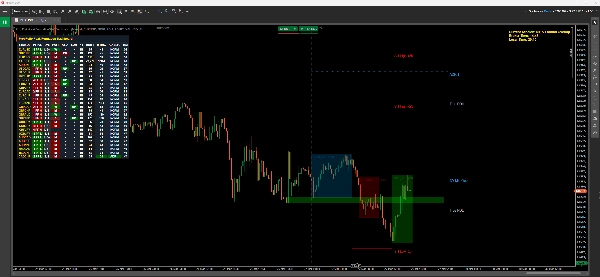
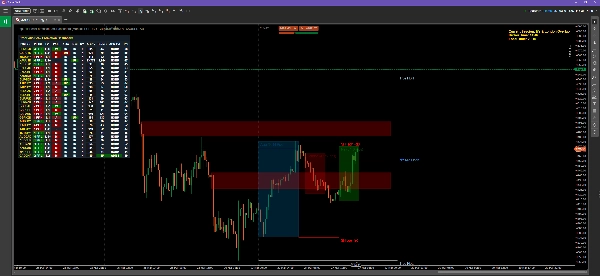
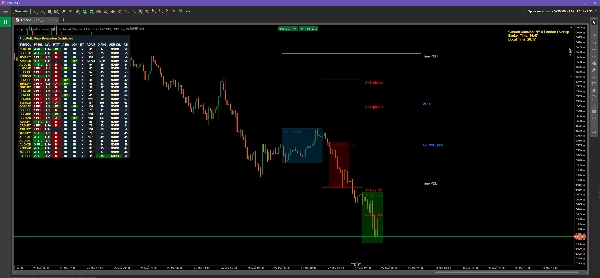
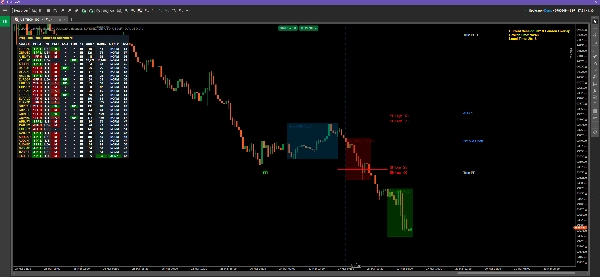
👁️ 3. ВИЗУАЛИЗАЦИЯ ГРАФИКА И ИНСТРУМЕНТЫ SMC
1. Killzones (Коробки ликвидности) Индикатор автоматически рисует прозрачные коробки для азиатской, лондонской и нью-йоркской сессий. Размер в пунктах каждой коробки указан внизу.
2. Линии охоты за стопами (BTMM) Линии проводятся на 25 и 50 пунктов выше и ниже коробки азиатской сессии. Это институциональные цели, где маркет-мейкеры охотятся за розничными стоп-лоссами перед разворотом тренда.
3. Истинный PDH и PDL Серебряные линии отмечают Истинный максимум предыдущего дня и Минимум предыдущего дня, рассчитанные строго от Истинного открытия Азии до Истинного закрытия Нью-Йорка (игнорируя мертвый объем переносов).
4. Спрос и предложение (S&D) Движок сканирует последние 150 свечей на предмет институционального дисбаланса.
- Красные коробки: Ненейтрализованное предложение (зоны продаж).
- Зеленые коробки: Ненейтрализованный спрос (зоны покупок).
- Примечание: Зоны исчезают, как только цена полностью их нейтрализует (протестирует).
5. Линии целей ADR На основе Пиковой Формы индикатор проецирует оранжевые или синие пунктирные линии, отмечающие цели истощения 1x, 2x и 3x Среднего Дневного Диапазона на день.
📈 4. ПРОФИЛЬ ОБЪЕМА (Гибкий vs. Фиксированный)
Индикатор оснащен полностью интегрированным движком профиля объема для определения Точки Контроля (POC) и Высокой/Низкой зоны стоимости (VAH/VAL).
Как использовать режим FLEXIBLE:
- В настройках индикатора убедитесь, что Режим VP установлен на
Flexible. - На вашем графике появятся две вертикальные пунктирные линии цвета аквамарин.
- Просто щелкните и перетащите эти линии, чтобы выделить любой ценовой участок на графике.
- Гистограмма профиля объема, POC и зона стоимости мгновенно рассчитаются и привяжутся к точной области между двумя линиями!
Как использовать режим FIXED: Установите режим в FixedDaily. Профиль автоматически рассчитает объем за текущий торговый день без необходимости перетаскиваемых линий.
⚙️ 5. ВРЕМЕННОЙ HUD И ОПОВЕЩЕНИЯ
Расширенный временной HUD В правом верхнем углу вы увидите золотой текстовый дисплей. Он автоматически рассчитывает время вашего брокера, локальное время компьютера и точно показывает, какая торговая сессия сейчас активна (например, "Перекрытие NY и Лондона").
Оповещения терминала Когда происходит новая Пиковая формация, уведомление выводится непосредственно во вкладке cTrader Automate -> Log, чтобы вы никогда не пропустили настройку. Примечание: Для расширенных внешних push-уведомлений посетите профиль разработчика Propfolio Solutions, чтобы узнать о расширенном наборе функций.
Сводка
Отзывы покупателей
5 | 100 % | |
4 | 0 % | |
3 | 0 % | |
2 | 0 % | |
1 | 0 % |