Opis
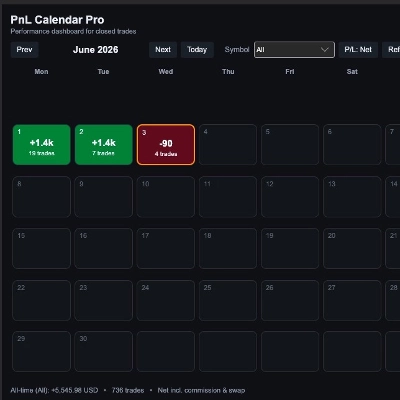
Przestań eksportować transakcje do arkuszy kalkulacyjnych. PnL Calendar Pro dodaje czystą zakładkę pulpitu do cTrader's Trade Watch która zamienia historię zamkniętych transakcji w coś, co możesz faktycznie przeczytać na pierwszy rzut oka — i aktualizuje się w momencie zamknięcia pozycji.
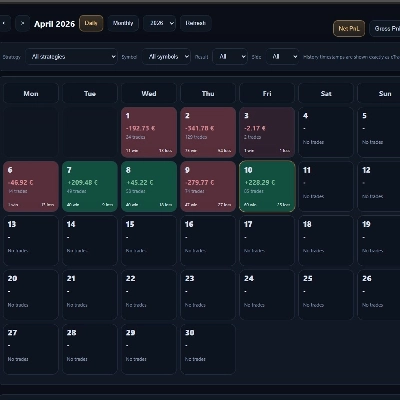
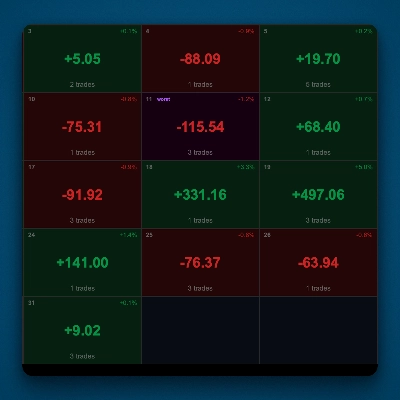
Kolorowy miesięczny kalendarz pokazuje Twoje dni zyskowne i stratne, zacienione w zależności od wielkości każdego dnia, obok pełnego podziału liczb, które mówią Ci, czy naprawdę się poprawiasz.
Kalendarz na pierwszy rzut oka
- Kolorowa miesięczna siatka — zielone dni wygrane, czerwone dni przegrane
- Intensywność heatmapy skalowana do wielkości P/L każdego dnia, dzięki czemu Twoje największe dni wyróżniają się natychmiast
- Liczba transakcji dziennie na każdy dzień
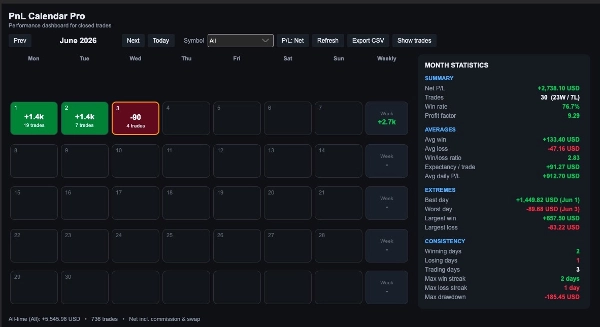
- Kolumna sum tygodniowych
- Dzisiaj wyróżnione; przechodź przez miesiące za pomocą Poprzedni / Następny / Dzisiaj
Kompletny pulpit wyników
- Zysk/strata netto, łączna liczba transakcji, wygrane kontra przegrane
- Wskaźnik wygranych i współczynnik zysku
- Średnia wygrana, średnia strata oraz stosunek wygranych do przegranych (payoff)
- Oczekiwana wartość na transakcję i średni dzienny P/L
- Najlepszy i najgorszy dzień, plus największa pojedyncza wygrana i przegrana transakcja
- Liczba dni wygranych / przegranych / handlowych
- Najdłuższe serie dni wygranych i przegranych
- Maksymalny spadek zamkniętych transakcji w miesiącu
Stworzony do tego, jak faktycznie handlujesz
- Filtruj według symbolu, aby analizować jeden instrument lub cały swój portfel
- Przełączaj między Netto (w tym prowizje i swap) a Brutto P/L
- Rozwijalna lista transakcji dla wybranego miesiąca
- Jednoklikowy eksport CSV do głębszej analizy
- Odświeżanie na żywo — pulpit aktualizuje się automatycznie, gdy pozycja zostaje zamknięta
Prywatny, lekki i natywny
- Odczytuje tylko Twoją lokalną historię zamkniętych transakcji — nic nie jest przesyłane ani wysyłane nigdzie
- Nie wymaga specjalnych uprawnień dostępu
- Elegancki ciemny motyw, który wtapia się w platformę
- Działa z cTrader na Windows i macOS
Dla kogo jest
Traderzy dyskrecjonalni i systematyczni, którzy chcą natychmiastowej, uczciwej informacji zwrotnej na temat swoich wyników — bez wychodzenia z platformy lub pilnowania arkusza kalkulacyjnego.
Pierwsze kroki
Zainstaluj wtyczkę, otwórz panel Trade Watch i wybierz zakładkę PnL Calendar Pro . Twój miesiąc zacznie się natychmiast wypełniać na podstawie historii transakcji.
Podsumowanie
Key features include a color-coded monthly calendar where winning days are shown in green and losing days in red, with heatmap intensity reflecting the size of each day’s profit or loss. The calendar displays daily trade counts, weekly totals, and highlights the current day, allowing easy navigation through months.
The performance dashboard provides comprehensive metrics such as net and gross P/L, total trades, win/loss counts, win rate, profit factor, average win/loss, payoff ratio, expectancy per trade, best/worst days, largest single trades, streaks, and maximum drawdown for the month.
Users can filter data by trading symbol, toggle between net and gross P/L, expand monthly trade lists, and export data to CSV for further analysis. The plugin operates locally without uploading data, requires no special permissions, and supports both Windows and macOS with a dark theme that integrates seamlessly into the platform.
Designed for discretionary and systematic traders, PnL Calendar Pro offers immediate, clear feedback on trading performance without leaving cTrader or managing external spreadsheets.