คำอธิบาย
ภาพรวม
กลยุทธ์นี้รวมตัวชี้วัดทางเทคนิคยอดนิยมสองตัวเพื่อระบุโอกาสในการเทรดที่มีความน่าจะเป็นสูง:
- Bollinger Bands ถูกใช้เพื่อตรวจจับราคาที่สุดขีดและโซนที่อาจเกิดการกลับตัว เปิดการเทรดเมื่อราคาสัมผัสแถบบนหรือแถบล่าง
- Relative Strength Index (RSI) กรองสัญญาณเหล่านี้โดยการวัดโมเมนตัมของตลาด การเทรดแบบ Long จะทำเมื่อ RSI อยู่ในโซนขายมากเกินไป และการเทรดแบบ Short จะทำเมื่อ RSI อยู่ในโซนซื้อมากเกินไป
โดยการรวมการวิเคราะห์แนวโน้มและโมเมนตัม หุ่นยนต์มีเป้าหมายเพื่อปรับปรุงจังหวะการเข้าและลดสัญญาณผิดพลาด
การตั้งค่าหลัก
พารามิเตอร์ทั้งหมดสามารถปรับแต่งได้อย่างเต็มที่ในแผงการตั้งค่าของ cBot:
- ปริมาณ (ล็อต) – ขนาดตำแหน่ง ค่าเริ่มต้น: 0.01 ล็อต
- Stop Loss / Take Profit (พิปส์) – ระดับความเสี่ยงและผลตอบแทนเริ่มต้น ค่าเริ่มต้น: SL 15 พิปส์ และ TP 30 พิปส์
- ช่วงเวลาของ RSI – ช่วงเวลาคำนวณสำหรับ RSI (ค่าเริ่มต้น: 14)
- ระดับ RSI ซื้อมากเกินไป / ขายมากเกินไป – เกณฑ์ที่กระตุ้นการตั้งค่า short/long (ค่าเริ่มต้น: 70 และ 30)
- ช่วงเวลาของ Bollinger – จำนวนแท่งที่ใช้คำนวณแถบ (ค่าเริ่มต้น: 20)
- ส่วนเบี่ยงเบนมาตรฐานของ Bollinger – ความกว้างของแถบ (ค่าเริ่มต้น: 2.0)
คุณสามารถปรับค่าป้อนข้อมูลเหล่านี้ให้เหมาะสมกับสัญลักษณ์และกรอบเวลาที่แตกต่างกัน
หมายเหตุสำคัญ
นี่คือ กลยุทธ์ง่ายๆ ที่เป็นการทดลอง ที่ออกแบบมาเพื่อแสดงให้เห็นว่าตัวชี้วัดหลายตัวสามารถรวมกันใน cBot ได้อย่างไร ไม่ได้มีเจตนาเป็นคำแนะนำทางการเงินและไม่รับประกันผลกำไร; ใช้ด้วยความเสี่ยงของคุณเองและทดสอบในบัญชีทดลองก่อนใช้งานจริงเสมอ
ไฮไลท์การทดสอบย้อนหลัง
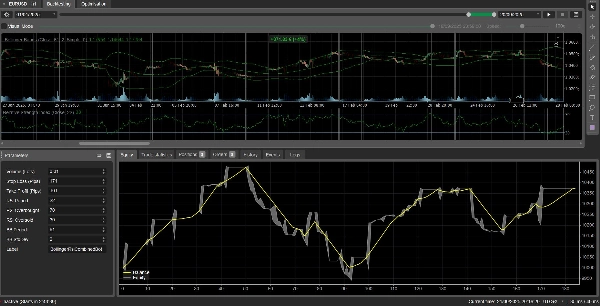
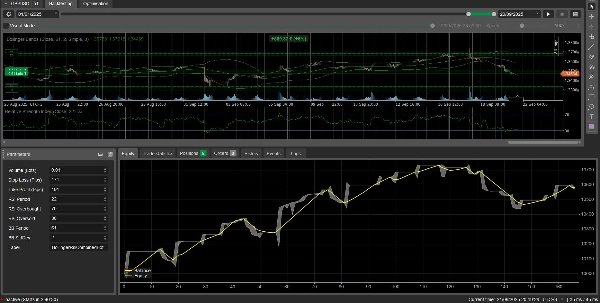
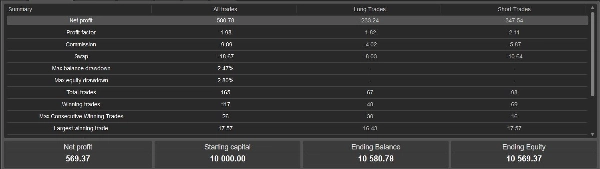
ในระหว่างการทดสอบล่าสุดกับข้อมูล EURUSD ในอดีต (กรอบเวลา H1) ด้วยการตั้งค่าเริ่มต้น บอทได้ผลลัพธ์ดังต่อไปนี้ (ดูภาพหน้าจอแนบ):
- กำไรสุทธิ: $580.78 (ยอดเงินเริ่มต้น $10,000)
- อัตรากำไร: 1.98
- จำนวนการเทรดทั้งหมด: 165 รายการ โดย 117 รายการเป็นการเทรดที่ชนะ
- การลดลงสูงสุดของยอดเงิน: 2.47 %
- การเทรดที่ชนะมากที่สุด: $17.57
- ส่วนของทุนสุดท้าย: $10,569.37
ตัวเลขเหล่านี้เป็นเพียงเพื่อการสาธิตเท่านั้น; ผลการดำเนินงานในอดีตไม่รับประกันผลลัพธ์ในอนาคต
สรุป
Key customizable settings include position volume, stop loss and take profit levels, RSI calculation period and threshold levels, as well as Bollinger Bands’ period and standard deviation. These parameters can be adjusted to fit different symbols and timeframes.
Backtesting on EURUSD (H1 timeframe) with default settings showed a net profit of $580.78 from a $10,000 starting balance, a profit factor of 1.98, and a maximum drawdown of 2.47%. The bot executed 165 trades, with 117 winners.
This strategy serves as a simple, experimental example of combining multiple indicators in automated trading. It is intended for demonstration purposes and should be tested on demo accounts before live use.