

R3.Alpha Analytics
ปลั๊กอินหลายแพลตฟอร์ม
1.09K ดาวน์โหลด
เวอร์ชัน 1.0, Sep 2026
Windows, Mac, Mobile, Web
4.9
รีวิว: 27

44.34M
ปริมาณการเทรด
45.33K
Pips ที่ได้กำไร
1.09K
ติดตั้งฟรี
คำอธิบาย
R3.Alpha Analytics เปลี่ยนประวัติการเทรด cTrader ของคุณให้เป็นรายงานผลการดำเนินงานและความเสี่ยงระดับสถาบัน — โดยอัตโนมัติ โดยไม่ต้องป้อนข้อมูลด้วยตนเอง มันอ่านการเทรดที่ปิดแล้วของคุณและคำนวณชุดข้อมูลเชิงปริมาณเต็มรูปแบบในสิบแท็บ:
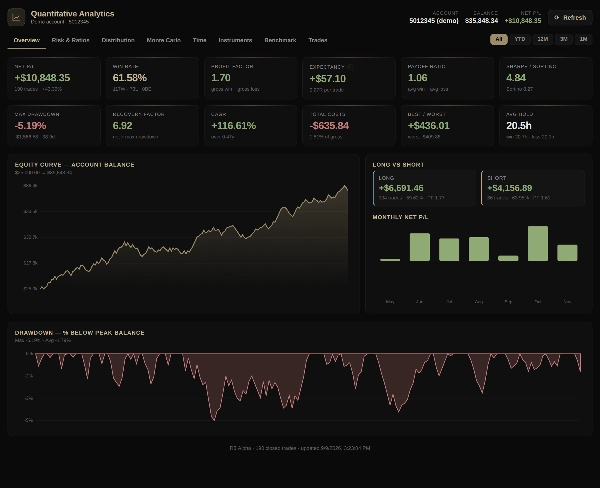
- ภาพรวม — กำไร/ขาดทุนสุทธิ, ร้อยละผลตอบแทนรวม, ผลตอบแทนเฉลี่ยรายเดือน, อัตราการชนะ, ปัจจัยกำไร, ความคาดหวัง, CAGR, การลดลงสูงสุด, กราฟเส้นทุนและการแบ่งระหว่างการถือยาวกับสั้น.
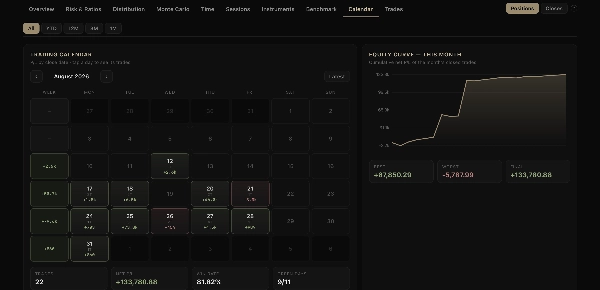
- ปฏิทิน — ปฏิทินการเทรดกำไร/ขาดทุนรายวันพร้อมยอดรวมรายสัปดาห์, มุมมองวันแบบแตะเพื่อเปิด และภาพรวมทั้งปี.
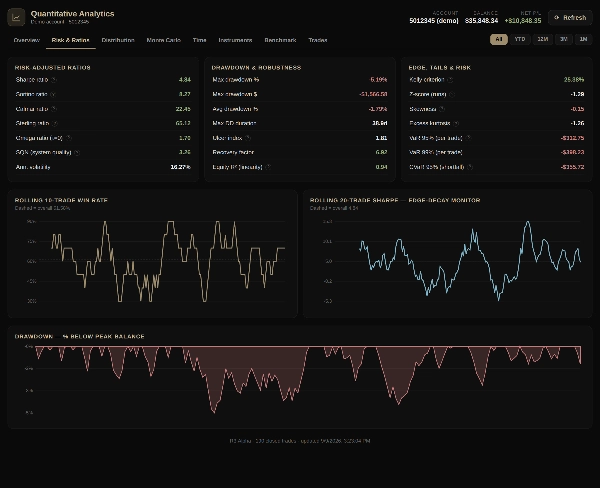
- ความเสี่ยง & อัตราส่วน — Sharpe, Sortino, Calmar, Sterling, Omega, SQN, VaR/CVaR, ดัชนี Ulcer, ปัจจัยการฟื้นตัว, อัตราการชนะแบบเลื่อนและ Sharpe แบบเลื่อน.
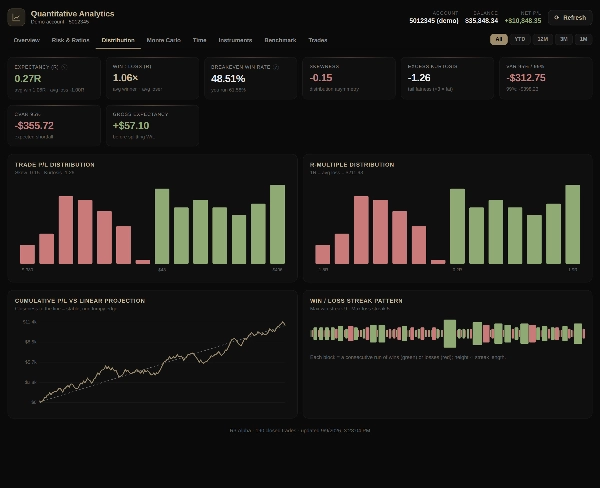
- การแจกแจง — R-multiples, ความเบ้, kurtosis, ฮิสโตแกรมกำไร/ขาดทุน และช่วงชนะ/แพ้ต่อเนื่อง.
- มอนติคาร์โล — ความเสี่ยงของการล้มละลาย, ความน่าจะเป็นของกำไร, การจำลองการลดลงและเปอร์เซ็นไทล์ของทุน.
- เวลา — ผลการดำเนินงานตามวันในสัปดาห์, ชั่วโมง, เดือน และระยะเวลาถือครอง.
- เซสชัน — เอเชีย, ลอนดอน, การทับซ้อนลอนดอน–นิวยอร์ก และนิวยอร์ก เปรียบเทียบตามความแข็งแกร่งและคุณภาพ พร้อมคู่สกุลเงินที่มีผลการดำเนินงานดีที่สุดในแต่ละเซสชัน.
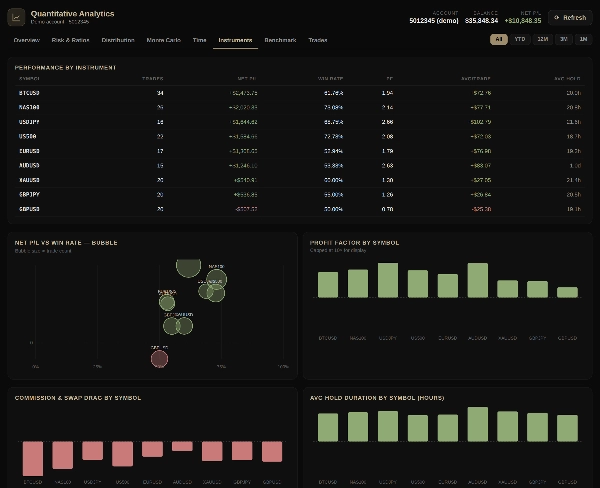
- เครื่องมือ — ผลลัพธ์, ปัจจัยกำไร, ค่าใช้จ่าย และระยะเวลาถือครองต่อสัญลักษณ์.
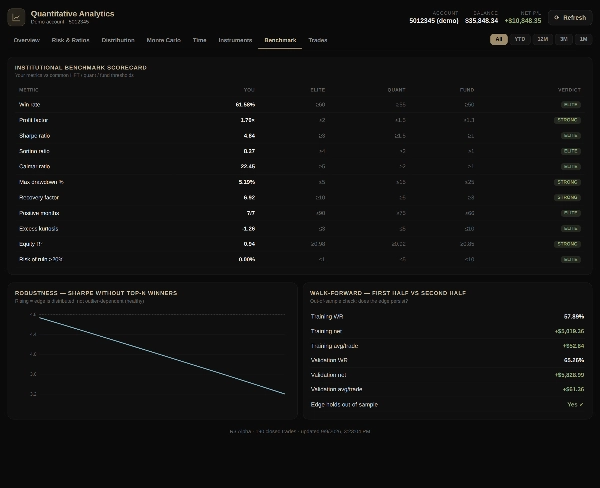
- เกณฑ์มาตรฐาน — บัตรคะแนนเทียบกับเกณฑ์ HFT, quant และกองทุน พร้อมการตรวจสอบแบบเดินหน้า.
- การเทรด — บันทึกการเทรดครบถ้วนพร้อมราคาการเข้าและออก, ระยะเวลาถือครอง, สวอป และค่าคอมมิชชั่น.
แผนภูมิทุกชิ้นมีความโต้ตอบได้ ตัวกรองช่วงเวลา (ทั้งหมด, YTD, 12M, 3M, 1M) คำนวณใหม่ทุกเมตริกตามขอบเขตปฏิทิน และสวิตช์ ตำแหน่ง / ปิด ช่วยให้คุณนับแต่ละตำแหน่งเป็นการเทรดหนึ่งครั้งหรือจับคู่สถิติของ cTrader เอง ซึ่งทุกการปิดบางส่วนถือเป็นการเทรดแยกต่างหาก ปลั๊กอินนี้เป็นแบบอ่านอย่างเดียวและไม่เคยทำการเทรด ใช้มันเพื่อตรวจสอบความได้เปรียบของคุณ, ติดตามการลดลงและความสม่ำเสมอ และดูอย่างชัดเจนว่าระบบของคุณทำงานอย่างไร.
สรุป
สรุปโดย AI
R3.Alpha Analytics is a web plugin designed for cTrader accounts that automatically generates institutional-grade performance and risk reports from your closed trade history. It provides a comprehensive quantitative analysis across eight interactive tabs, including:
1. Overview: net profit/loss, win rate, profit factor, expectancy, CAGR, and drawdown.
2. Risk & Ratios: metrics such as Sharpe, Sortino, Calmar, Sterling, Omega, SQN, VaR/CVaR, Ulcer index, and recovery factor.
3. Distribution: analysis of R-multiples, skewness, kurtosis, and profit/loss histograms.
4. Monte Carlo simulations: risk of ruin, probability of profit, and equity percentiles.
5. Time and instrument breakdowns.
6. Benchmark scorecard: compares performance against high-frequency trading, quantitative, and fund thresholds with walk-forward validation.
7. Full trade log.
All charts are interactive with period filters that dynamically update metrics. The plugin operates in read-only mode and does not place trades. It is intended for auditing trading edge, monitoring drawdowns and consistency, and detailed system performance evaluation.
โปรไฟล์ปลั๊กอิน
หมวดหมู่ปลั๊กอิน
การวิเคราะห์
การเข้าถึงข้อมูล
โพสิชัน
ประวัติ
คำสั่ง
บัญชี
การสนทนา
รีวิวจากลูกค้า
4.9
รีวิว: 27
5 | 96 % | |
4 | 4 % | |
3 | 0 % | |
2 | 0 % | |
1 | 0 % |
รีวิวจากลูกค้า
October 19, 2026
R3.Alpha Analytics presents detailed trading statistics, risk metrics, costs and performance charts in a polished dashboard. The 844-trade Overview shows consistent trade counts, win rate and Long/Short totals. The detachable window is particularly effective. In the narrow Symbol Tab, tooltip overlap and multi-line navigation slightly reduce usability. Score: 4.7/5.
October 14, 2026
October 14, 2026
A good thing for those who want to approach trading a little more systematically, Overall, everything is simple and clear, I liked it, especially for the weekly debriefing
October 14, 2026

October 14, 2026
I don't usually write reviews, but this is really more convenient than my old analysis method, and requires much less manual work
October 12, 2026
October 11, 2026
the Positions / Closes switch keeps partial exits from muddling the statistics, with 10 analytics tabs and 1M, 3M and 12M views giving returns, R multiples and drawdown a properly detailed account review.
October 10, 2026
October 7, 2026
October 7, 2026
October 7, 2026
October 6, 2026
October 6, 2026

October 6, 2026
After analyzing my results, I realized that my problem isn’t the win rate, but the size of my losing trades, very useful
October 2, 2026
Comparing complete positions with individual closes gives the account statistics some useful context. The 1M, 3M and 12M windows sit alongside R multiples and drawdown rather than leaving the review at a plain profit total.
September 30, 2026
September 30, 2026
I like that the statistics here don't just look like a bunch of numbers. This one can actually be used to analyze trading
September 28, 2026
September 28, 2026

September 25, 2026
I've used several similar tools I particularly liked the detailed trading history

September 25, 2026
After connecting, I immediately discovered several things in my trading that I hadn't noticed before, thank you

September 21, 2026
คำถามที่พบบ่อย
Risk/Reward
Risk/Reward
Trade Journal
Trade Statistics
ผลิตภัณฑ์ที่มีให้บริการผ่าน cTrader Store รวมถึงบอทการเทรด อินดิเคเตอร์ และปลั๊กอิน มีให้บริการโดยนักพัฒนาบุคคลที่สามและมีไว้เพื่อวัตถุประสงค์ในการเข้าถึงข้อมูลและทางเทคนิคเท่านั้น cTrader Store ไม่ใช่โบรกเกอร์และไม่ได้ให้คำแนะนำการลงทุน คำแนะนำส่วนบุคคล หรือการรับประกันผลการดำเนินงานในอนาคต
เพิ่มเติมจากผู้เขียนคนนี้




















ราคา
44.34M
ปริมาณการเทรด
45.33K
Pips ที่ได้กำไร
1.09K
ติดตั้งฟรี