Описание
Откройте для себя точную торговлю с нашей революционной технологией отслеживания трендов
BrickAlgo TrendTracker — это лучший индикатор определения тренда, разработанный специально для cTrader. Этот мощный технический инструмент помогает легко выявлять ключевые развороты рынка, предоставляя четкие визуальные сигналы для оптимальных точек входа и выхода.
Основные характеристики:
- Динамическое обнаружение тренда: Определяет изменения тренда на основе анализа ценового действия
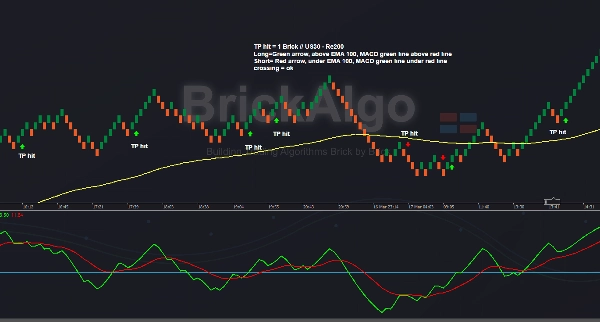
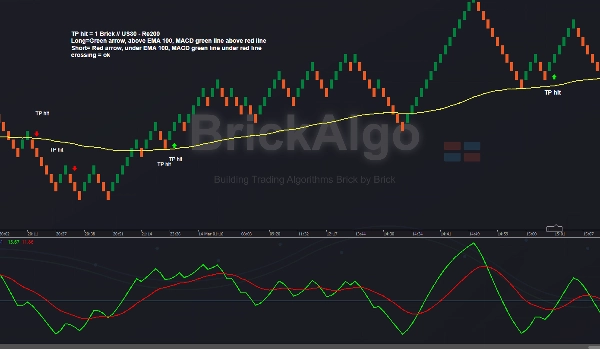
- Визуальная система сигналов: Цветные стрелки показывают смену бычьего и медвежьего трендов
- Отслеживание производительности: Опциональное отображение значения пипсов показывает прибыль/убыток между сигналами
- Настраиваемые параметры: Регулируйте параметры в соответствии с вашим стилем торговли и таймфреймом
- Чистый интерфейс графика: Дизайн наложения сохраняет ваши графики без загромождений
Как это работает:
BrickAlgo TrendTracker анализирует движения цены, сравнивая текущие значения со сглаженными средними значениями максимумов и минимумов. Когда обнаруживается значительное изменение паттерна, индикатор генерирует сигнал, помогая вам выявлять потенциальные развороты тренда до того, как они станут очевидны другим трейдерам.
Вот краткое объяснение того, как использовать индикатор:
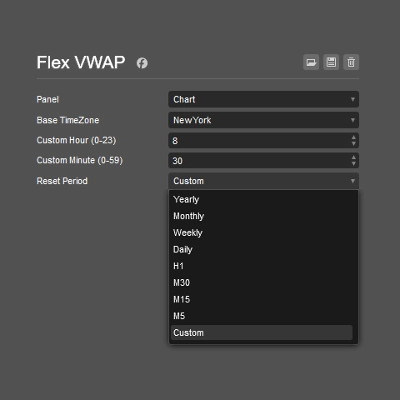
- Загрузите индикатор: Добавьте индикатор на ваш график из меню индикаторов в cTrader.
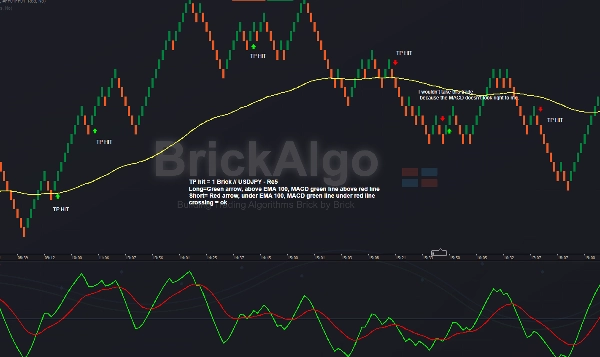
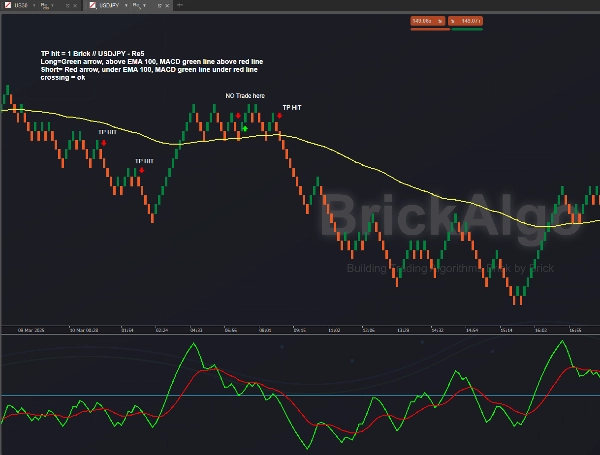
- Используйте график Renko (например, Re5): Убедитесь, что вы используете график Renko, такой как Re5, который приведён в качестве примера. Индикатор работает с разными размерами кирпичиков. Лично я торгую USDJPY на Re5 и US30 на Re100 и Re200 с этим индикатором.
- Настройте параметры: Ознакомьтесь с предоставленными скриншотами для рекомендуемых настроек индикатора.
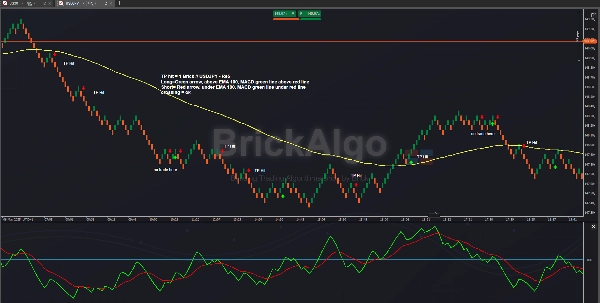
- Фильтруйте сигналы: Для лучшего подтверждения сделок используйте MACD, как показано на скриншотах, подтверждение на более высоком таймфрейме, уровни поддержки и сопротивления, EMA или другие индикаторы BrickAlgo, такие как BrickAlgo TrendPulse.
- TP и SL: Я использую 1 размер кирпичика для тейк-профита (TP), а стоп-лосс (SL) варьируется, обычно от 1 до 3 кирпичиков.
Лично я предпочитаю торговать USDJPY на графике Re5 и использовать 100 EMA и MACD, как показано на скриншотах. Для дополнительных сделок я использую BrickAlgo TrendPulse.


![Логотип продукта "[CB] Pivot Points Pro"](https://cdn.ctrader.com/image/webp/43463c82-67b0-4f10-a4ba-901bba091d81_32594)