Mô tả
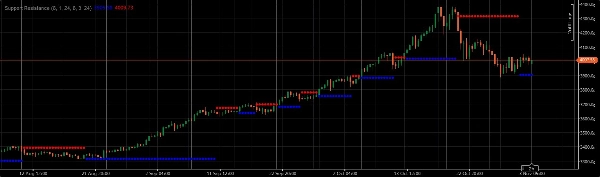
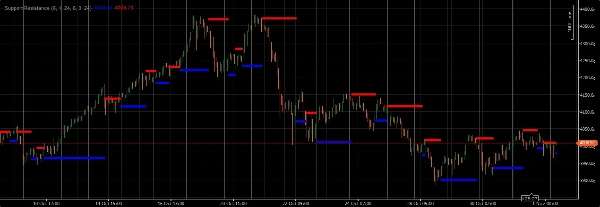
Khi giao dịch vàng, hãy sử dụng các mức hỗ trợ và kháng cự trên nhiều khung thời gian khác nhau (biểu đồ lớn, phạm vi và tick) để xác định các điểm phá vỡ pivot tiềm năng hoặc các điểm hỗ trợ/kháng cự. Luôn xác nhận các tín hiệu này với các chỉ báo kỹ thuật khác như đường trung bình động, bộ dao động và mẫu nến để có các giao dịch với xác suất cao hơn
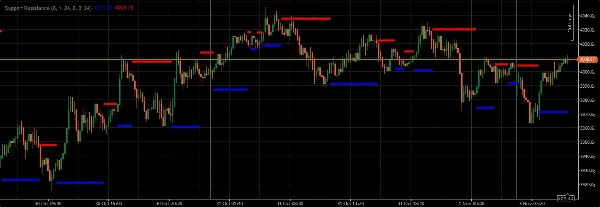
Khi giao dịch vàng, hãy sử dụng các mức hỗ trợ và kháng cự trên nhiều khung thời gian khác nhau (biểu đồ lớn, phạm vi và tick) để xác định các điểm phá vỡ pivot tiềm năng hoặc các điểm hỗ trợ/kháng cự. Khi giao dịch vàng, hãy sử dụng các mức hỗ trợ và kháng cự trên nhiều khung thời gian khác nhau (biểu đồ lớn, phạm vi và tick) để xác định các điểm phá vỡ pivot tiềm năng hoặc các điểm hỗ trợ/kháng cự. Những mức này, khi đã được xác định, có thể đóng vai trò là các điểm quyết định quan trọng. Một sự phá vỡ trên mức kháng cự hoặc dưới mức hỗ trợ, đặc biệt khi đi kèm với cây nến thân lớn hơn, thường báo hiệu sự tiếp tục của xu hướng hoặc sự thay đổi đáng kể trong tâm lý thị trường. Ngược lại, một sự bật lên từ mức hỗ trợ hoặc sự từ chối tại mức kháng cự có thể chỉ ra một sự đảo chiều tiềm năng hoặc sự tiếp tục của giai đoạn tích lũy hiện tại. Luôn xác nhận các tín hiệu này với các chỉ báo kỹ thuật khác như đường trung bình động, bộ dao động và mẫu nến để có các giao dịch với xác suất cao hơn. Hơn nữa, hãy chú ý kỹ đến các sự kiện tin tức và các dữ liệu kinh tế được công bố, vì chúng có thể ảnh hưởng mạnh đến giá vàng và làm mất hiệu lực các thiết lập kỹ thuật thuần túy. Quản lý rủi ro là điều tối quan trọng; không bao giờ mạo hiểm hơn một tỷ lệ nhỏ vốn giao dịch của bạn trong bất kỳ giao dịch đơn lẻ nào.
Tóm tắt
Đánh giá của khách hàng
5 | 100 % | |
4 | 0 % | |
3 | 0 % | |
2 | 0 % | |
1 | 0 % |


