SwingHighLowDetector
Chỉ báo
Phiên bản 2.2, Jan 2026
Windows, Mac
5.0
Đánh giá: 3
Mô tả
Đây là một chỉ báo độ chính xác cao để tìm các điểm xoay chiều.
Người dùng có thể tùy chỉnh chỉ báo này để gửi cảnh báo cũng như các cửa sổ bật lên trên biểu đồ và các thiết bị khác của họ.
Cách sử dụng:
- Gắn chỉ báo vào biểu đồ.
- Nó sẽ tính toán các điểm xoay chiều trong quá khứ và hiển thị trên màn hình
- Tùy chỉnh các tham số theo sở thích của bạn liên quan đến số lượng bản ghi quá khứ tối đa để theo dõi.
- Để tạo cảnh báo, bật tùy chọn "Alert Allowed" để gửi cảnh báo động đến các thiết bị của bạn khi có bất kỳ điểm xoay chiều nào được hình thành cũng như kích hoạt.
- Một tính năng khác sẽ phát hiện nếu giá đã vượt qua các điểm xoay chiều thì nó sẽ loại bỏ chỉ báo đó khỏi phân tích. (Bật tham số "Remove Swept levels")
- Cuối cùng, tùy chỉnh tham số "Past Swing Days Alerts" để nhận cảnh báo cho tất cả các điểm xoay chiều được tạo ra trong N ngày qua.
Tại sao nên mua chỉ báo này?
- Để giảm bớt việc phân tích các điểm xoay chiều cho các thị trường khác nhau.
- Với sự trợ giúp của chỉ báo của chúng tôi, bạn có thể dễ dàng hình dung các điểm xoay chiều cũng như nhận cảnh báo trên thiết bị của mình, điều này sẽ tiết kiệm rất nhiều thời gian của bạn.
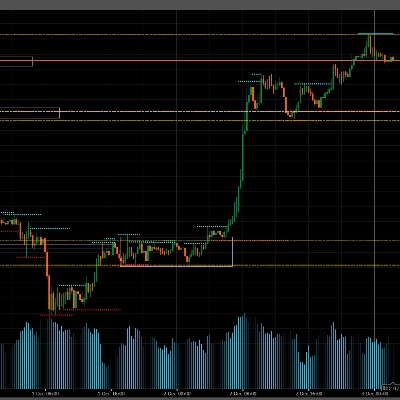
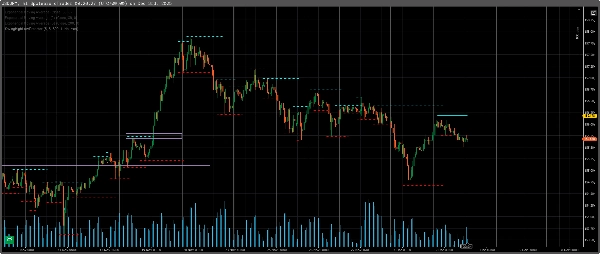
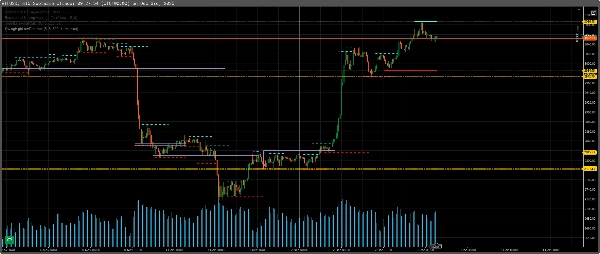
Chi tiết đồ họa chung:
- Các đường chấm màu xanh nước biển là các điểm xoay chiều cao trong quá khứ
- Đường chấm liền màu xanh là điểm xoay chiều cao mới nhất
- Các đường chấm màu đỏ là các điểm xoay chiều thấp trong quá khứ
- Đường chấm liền màu đỏ là điểm xoay chiều thấp mới nhất
Tóm tắt
Hồ sơ chỉ báo
Đánh giá của khách hàng
5.0
Đánh giá: 3
5 | 100 % | |
4 | 0 % | |
3 | 0 % | |
2 | 0 % | |
1 | 0 % |
Đánh giá của khách hàng
December 14, 2025
A calm trader gets value from the idea has to earn the click. Overconfidence is the real danger.
December 4, 2025
Thảo luận
Câu hỏi thường gặp
BTCUSD
Forex
Breakout
Indices
EURUSD
Commodities
GBPUSD
NZDUSD
Prop
Crypto
Stocks
XAUUSD
NAS100
USDJPY
Các sản phẩm có sẵn trên cTrader Store, bao gồm bot giao dịch, chỉ báo và plugin, được cung cấp bởi các nhà phát triển bên thứ ba và chỉ nhằm mục đích cung cấp thông tin và tiếp cận kỹ thuật. cTrader Store không phải là nhà môi giới và không cung cấp lời khuyên đầu tư, khuyến nghị cá nhân hay bất kỳ đảm bảo nào về hiệu suất trong tương lai.


Giá
Kể từ 13/03/2025