
Mô tả
Light version of Market Trends plugin
Check out all our products here.
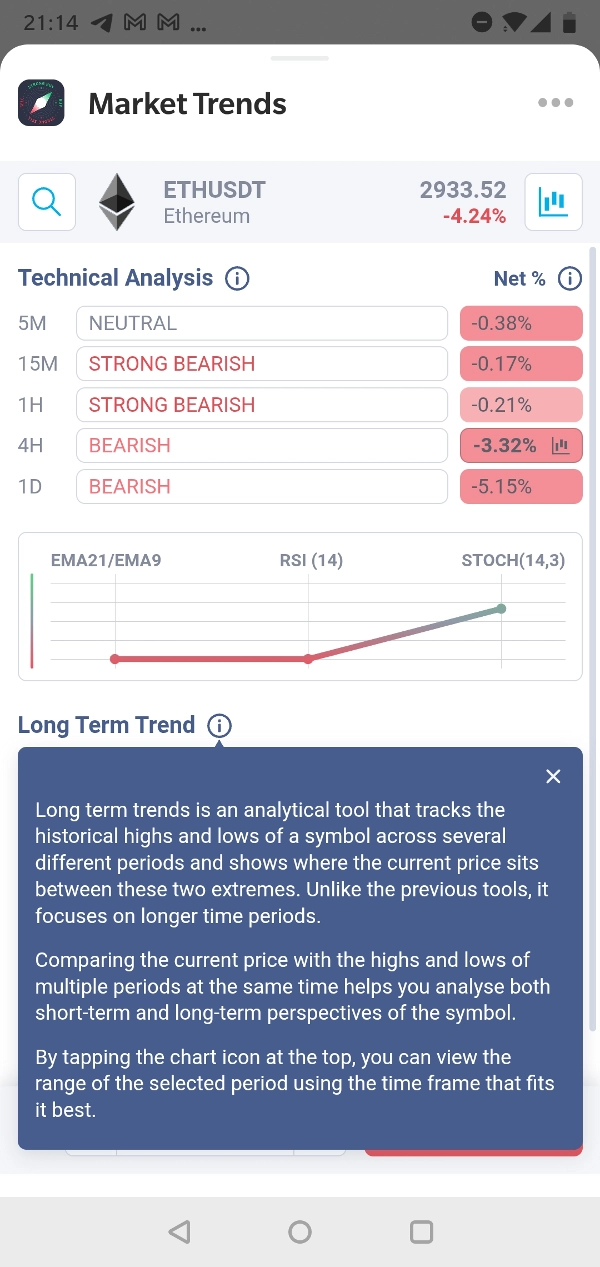
Market Trends combines three analytical tools to help traders quickly evaluate market direction, momentum, and price context across different time frames.
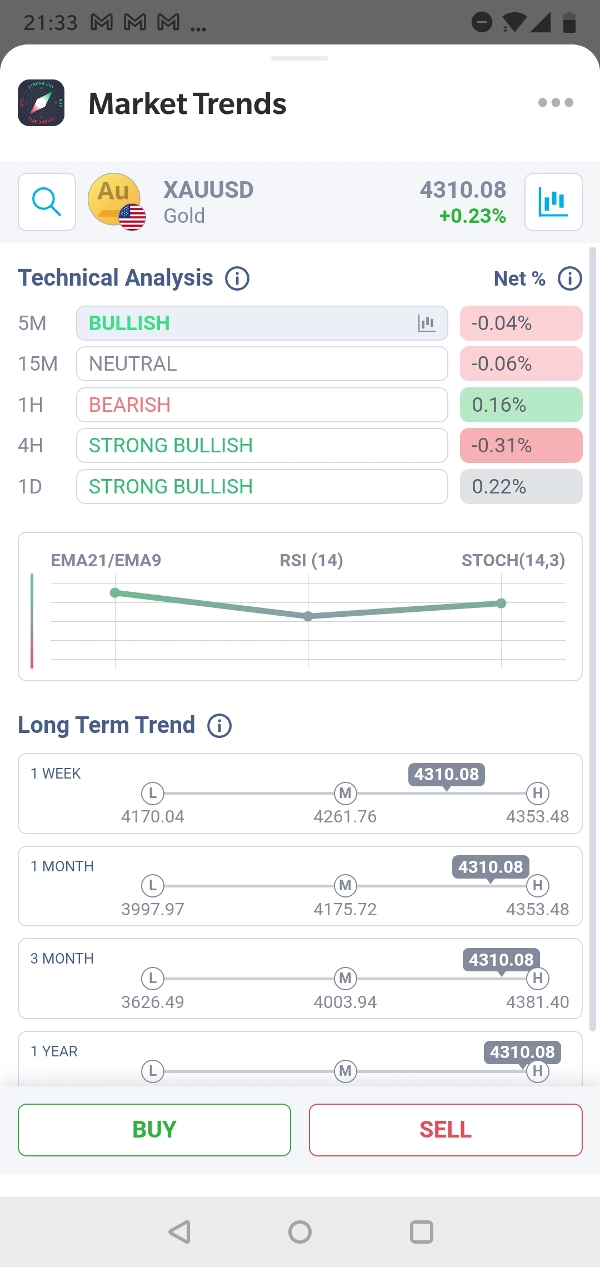
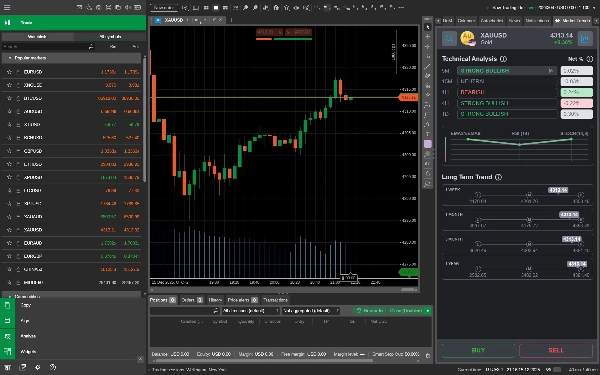
Technical analysis trend detection is based on a combination of RSI (14), Stochastic (14, 3, 3), and the percentage difference between EMA (9) and EMA (21). These indicators are aggregated into a simple rating from Strong Bullish to Strong Bearish, allowing traders to assess directional bias across several time frames and confirm it on the live chart.
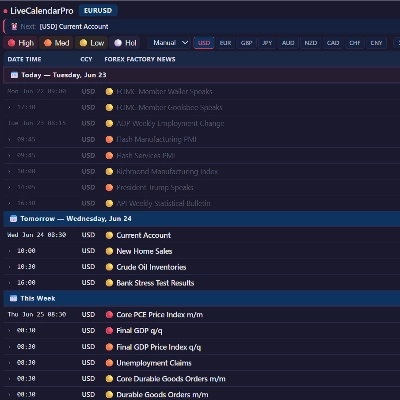
Heatmaps display percentage price changes over multiple rolling periods, updating with each new quote. A color scale highlights both direction and strength of movement, making it easy to compare symbols and time frames at a glance.
Long-term analysis adds broader context by showing the current price relative to historical highs and lows across longer periods. This helps traders balance short-term signals with the overall market structure.
Tóm tắt
1. Trend Signals: Combines RSI (14), Stochastic (14, 3, 3), and the percentage difference between EMA (9) and EMA (21) into a consolidated rating ranging from Strong Bullish to Strong Bearish. This helps assess directional bias and confirm trends on live charts.
2. Heatmaps: Display percentage price changes over various rolling periods with a color scale indicating the direction and strength of price movements. This feature facilitates quick comparison of symbols and time frames.
3. Long-Term Analysis: Provides context by showing the current price relative to historical highs and lows over extended periods, supporting a balanced view of short-term signals within the overall market structure.
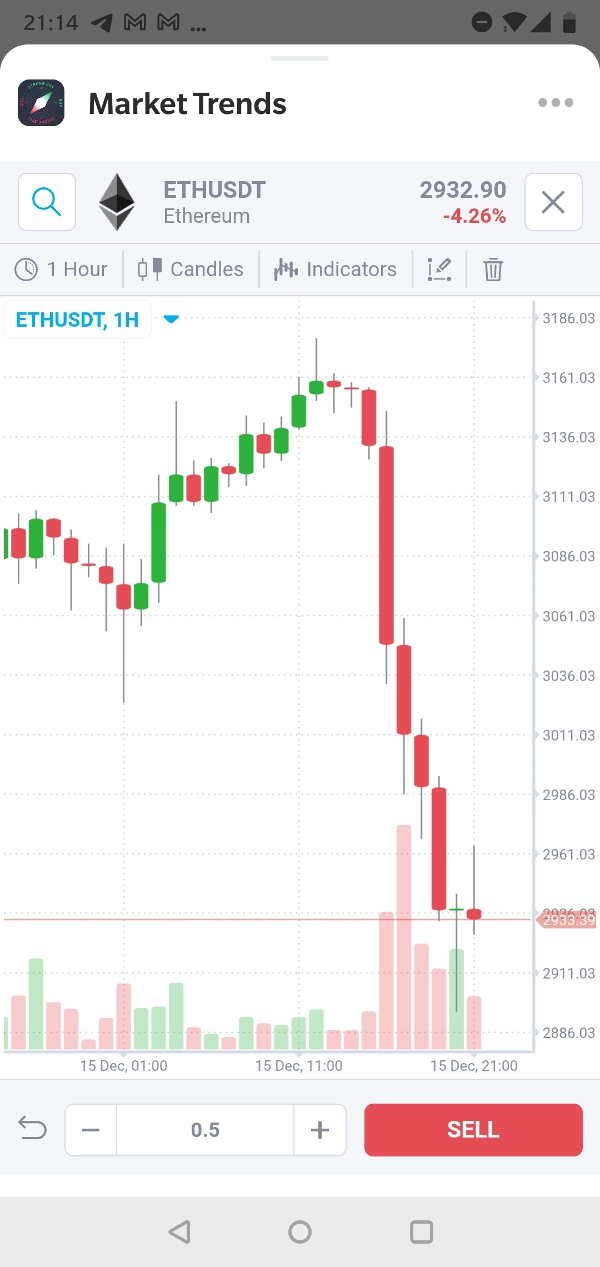
Market Trends supports analysis across multiple markets including Forex, Crypto, Commodities, and symbols such as BTCUSD and XAUUSD. It leverages technical indicators like RSI and Bollinger Bands to deliver comprehensive trend evaluation.
Đánh giá của khách hàng
5 | 90 % | |
4 | 0 % | |
3 | 10 % | |
2 | 0 % | |
1 | 0 % |