
VMM PositionPivotPro
Chỉ báo
Phiên bản 2.0, Jan 2026
Windows, Mac
Mô tả
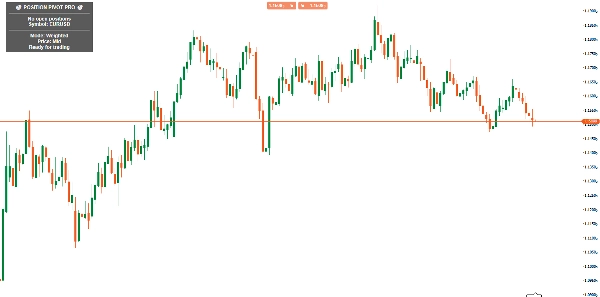
Position Pivot Pro là một công cụ quản lý vị trí nâng cao được thiết kế cho các nhà giao dịch thực hiện nhiều lệnh vào cùng một tài sản. Chỉ báo tự động tính toán điểm pivot trung bình của tất cả các vị trí mở, cung cấp một tham chiếu trực quan quan trọng trên biểu đồ.
Các tính năng chính:
- Tính toán Pivot theo thời gian thực:
-
- Trung bình đơn giản: Trung bình số học của giá vào lệnh
- Trung bình có trọng số theo khối lượng: (Mặc định) Xem xét khối lượng của từng vị trí để có điểm pivot chính xác hơn
- Đường biểu đồ động tự điều chỉnh
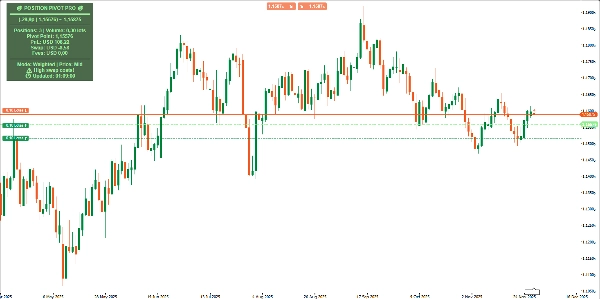
- Bảng thông tin đầy đủ:
-
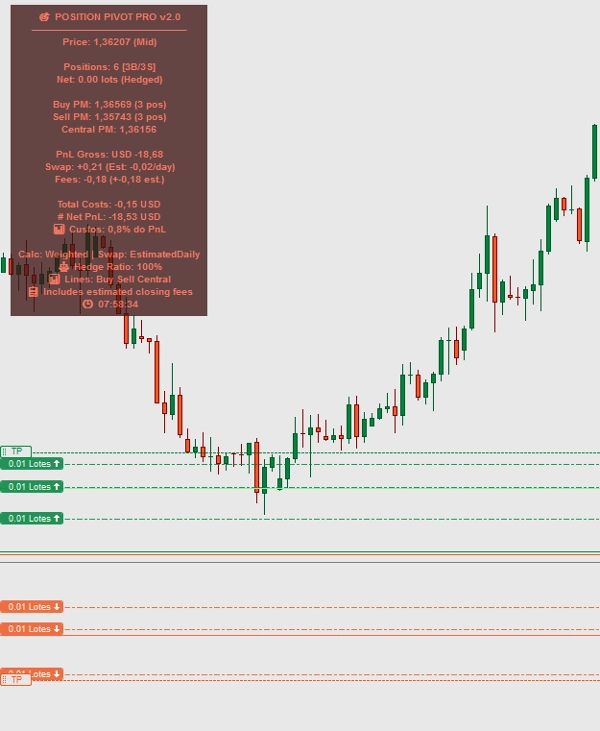
- Hiển thị điểm pivot đã tính toán
- Hiển thị sức mạnh di chuyển bằng pips (khoảng cách từ giá hiện tại)
- Tổng số vị trí và khối lượng tính bằng lot
- Lãi/lỗ chưa thực hiện, swap tích lũy và tổng hoa hồng
- Hệ thống cảnh báo chi phí:
-
- Cảnh báo trực quan khi hoa hồng hoặc swap vượt quá giới hạn có thể cấu hình
- Cảnh báo cho chi phí tuyệt đối cao
- Màu sắc động (xanh/lợi nhuận, đỏ/thua lỗ, trung tính)
- Đặc điểm kỹ thuật:
-
- Không trễ: Tính toán theo thời gian thực không có độ trễ
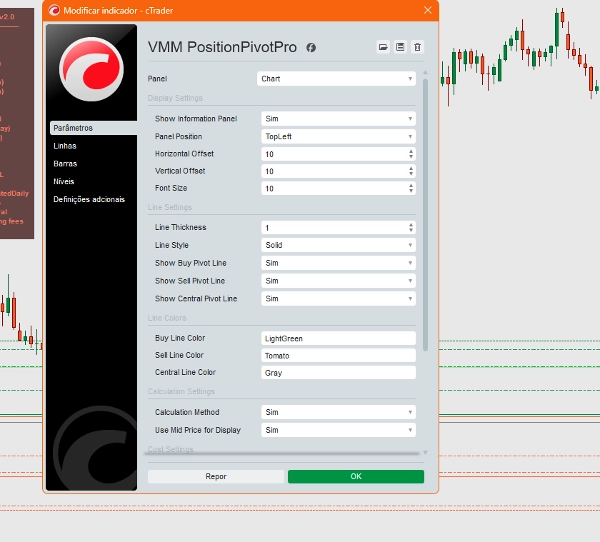
- Hoàn toàn tùy chỉnh: Vị trí bảng, màu sắc, độ dày đường
- Chế độ Giá Mid/Bid: Chọn tham chiếu tính toán
- Cập nhật tự động khi có thay đổi vị trí
Lợi ích cho nhà giao dịch:
- Ra quyết định nhanh hơn với cái nhìn tổng hợp về tất cả các vị trí
- Quản lý rủi ro cải thiện bằng cách xác định điểm hòa vốn
- Tối ưu hóa chi phí với việc theo dõi swap và hoa hồng
- Phân tích sức mạnh di chuyển liên quan đến pivot
Các trường hợp sử dụng:
- Tăng/giảm vị trí: Xác định giá trung bình lý tưởng để thêm/bớt vị trí
- Quản lý phòng ngừa rủi ro: Theo dõi các vị trí đối nghịch cùng lúc
- Giao dịch theo xu hướng: Theo dõi sự phát triển của các lệnh vào dần dần
- Giao dịch trong ngày: Kiểm soát chính xác nhiều giao dịch trong ngày
Hoàn hảo cho các nhà giao dịch sử dụng chiến lược pyramiding, martingale hoặc nhiều lệnh vào, biến dữ liệu phức tạp thành thông tin có thể hành động trực tiếp trên biểu đồ.
Tóm tắt
Hồ sơ chỉ báo
Đánh giá của khách hàng
0.0
Đánh giá: 0
Đánh giá của khách hàng
Sản phẩm này chưa có đánh giá nào. Bạn đã dùng thử chưa? Hãy là người đầu tiên chia sẻ với mọi người!
Thảo luận
Câu hỏi thường gặp
BTCUSD
Forex
Indices
EURUSD
Commodities
GBPUSD
NZDUSD
Crypto
Stocks
XAUUSD
NAS100
USDJPY
Các sản phẩm có sẵn trên cTrader Store, bao gồm bot giao dịch, chỉ báo và plugin, được cung cấp bởi các nhà phát triển bên thứ ba và chỉ nhằm mục đích cung cấp thông tin và tiếp cận kỹ thuật. cTrader Store không phải là nhà môi giới và không cung cấp lời khuyên đầu tư, khuyến nghị cá nhân hay bất kỳ đảm bảo nào về hiệu suất trong tương lai.
Sản phẩm khác của tác giả này


Giá
Kể từ 28/12/2024
54
Cài đặt miễn phí