
Mô tả
Meravith Auto là phiên bản tự động của hệ thống giao dịch thủ công Meravith.
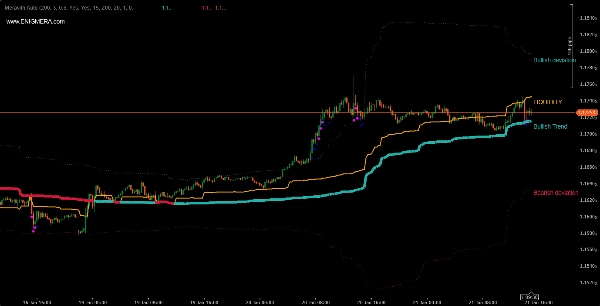
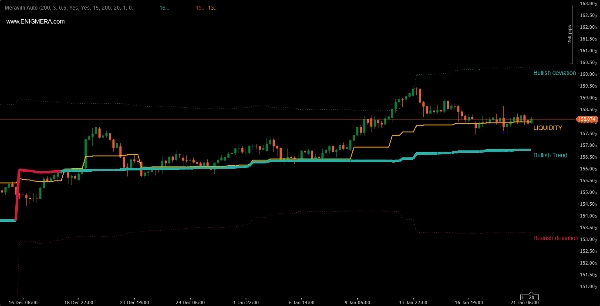
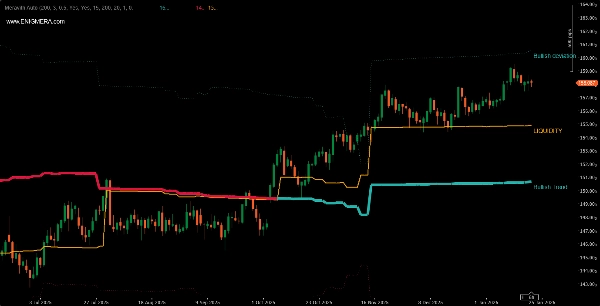
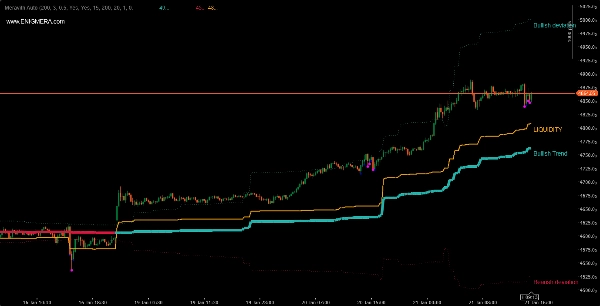
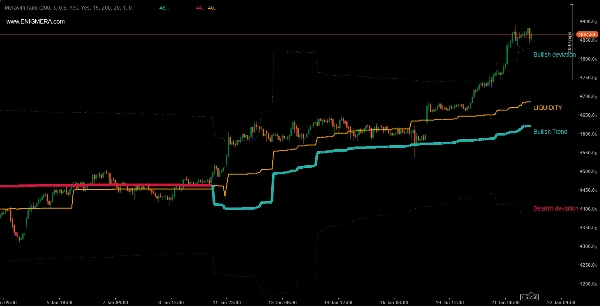
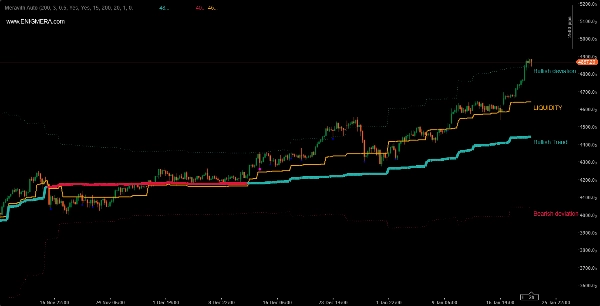
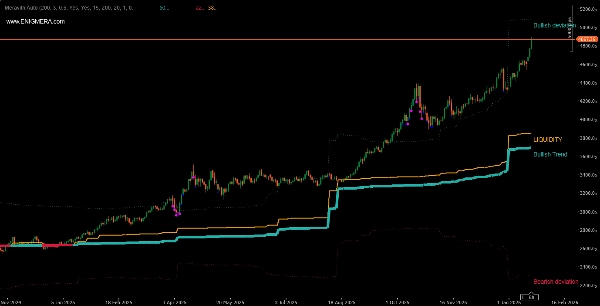
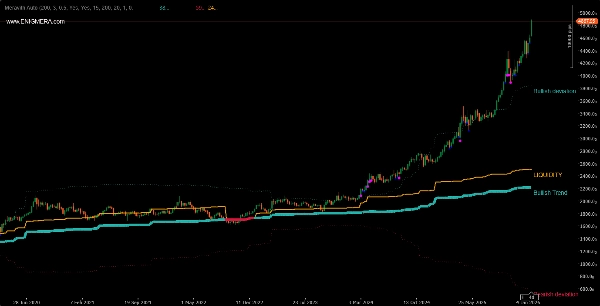
Chỉ báo bao gồm:
- Đường xu hướng thay đổi màu sắc. Khi tăng giá thì màu xanh lá, khi giảm giá thì màu đỏ. Đây là đường hỗ trợ xu hướng.
- Đường thanh khoản, nơi khối lượng tăng bằng khối lượng giảm.
- Đường lệch ba lần tăng giá.
- Đường lệch ba lần giảm giá.
- Các chấm tím và xanh dương chỉ ra khối lượng cao. Chấm tím chỉ ra khối lượng lớn hơn hai độ lệch so với khối lượng trung bình, và chấm xanh dương là hai độ lệch.
Cách sử dụng nó?
- Đường xu hướng tăng cộng với thanh khoản trên đường xu hướng bằng một xu hướng tăng. Chúng ta kỳ vọng thị trường sẽ đi lên. Chúng ta mở các vị thế mua.
- Đường xu hướng giảm cộng với thanh khoản dưới đường xu hướng bằng một xu hướng giảm. Chúng ta kỳ vọng thị trường sẽ đi xuống. Chúng ta mở các vị thế bán.
Kết hợp nó theo ý bạn với các chỉ báo khác.
Nó có thể được sử dụng trên bất kỳ cặp tiền tệ và khung thời gian nào.
Bạn có thể thấy kết quả khác nhau với các nhà môi giới khác nhau do khối lượng họ báo giá.
Các nhà môi giới lớn hơn được ưu tiên do khối lượng cao hơn.
Sự khác biệt giữa phiên bản tự động và thủ công là gì?
- Trong phiên bản thủ công, chúng ta có đánh giá xu hướng dựa trên đỉnh và đáy. Theo đó, nó cũng cung cấp các mức cạn kiệt khối lượng trên thị trường.
- Trong phiên bản tự động, chúng ta có một khoảng thời gian thay đổi qua các giai đoạn thị trường khác nhau. Nó có thể thay đổi, ngắn trong thời kỳ biến động cao và dài trong thời kỳ biến động thấp. Ở đây không có các mức cạn kiệt, vì không phân tích xu hướng mà là khoảng thời gian. Đây là lý do chúng ta có các độ lệch. Mặc định, độ lệch ba lần được hiển thị.
Tóm tắt
Hồ sơ chỉ báo
Đánh giá của khách hàng
0.0
Đánh giá: 0
Đánh giá của khách hàng
Sản phẩm này chưa có đánh giá nào. Bạn đã dùng thử chưa? Hãy là người đầu tiên chia sẻ với mọi người!
Thảo luận
Câu hỏi thường gặp
BTCUSD
Forex
Signal
Breakout
Indices
EURUSD
Commodities
GBPUSD
NZDUSD
Prop
Scalping
Crypto
Stocks
XAUUSD
NAS100
USDJPY
VWAP
Các sản phẩm có sẵn trên cTrader Store, bao gồm bot giao dịch, chỉ báo và plugin, được cung cấp bởi các nhà phát triển bên thứ ba và chỉ nhằm mục đích cung cấp thông tin và tiếp cận kỹ thuật. cTrader Store không phải là nhà môi giới và không cung cấp lời khuyên đầu tư, khuyến nghị cá nhân hay bất kỳ đảm bảo nào về hiệu suất trong tương lai.


Giá
Kể từ 24/10/2025