
Mô tả
Chỉ báo cAlgo được cung cấp, AutoPositionSizingRR, được thiết kế để giúp các nhà giao dịch tự động tính toán và quản lý kích thước vị thế dựa trên rủi ro, mức dừng lỗ và chốt lời. Nó có thể tùy chỉnh và có thể áp dụng cho cả thị trường cổ phiếu và forex, cung cấp thông tin chi tiết về một thiết lập giao dịch. Dưới đây là phân tích về chức năng chính và các tính năng của nó:
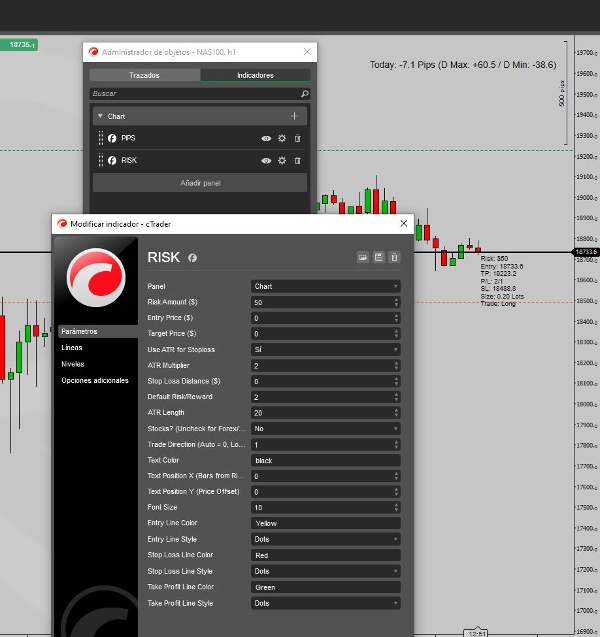
Các tính năng chính:
- Kích thước vị thế dựa trên rủi ro: Tính toán kích thước lot tối ưu dựa trên số tiền rủi ro đã chỉ định và khoảng cách giữa giá vào lệnh và mức dừng lỗ.
- Tham số có thể tùy chỉnh: Người dùng có thể thiết lập các tham số như số tiền rủi ro, giá vào lệnh, giá mục tiêu, khoảng cách dừng lỗ, hệ số ATR và nhiều hơn nữa, cho phép quản lý rủi ro theo cách cá nhân hóa.
- Dừng lỗ và chốt lời động: Có thể tính toán dừng lỗ và chốt lời dựa trên khoảng cách cố định, ATR (Average True Range), hoặc tỷ lệ rủi ro/lợi nhuận đã định trước.
- Hỗ trợ Forex & Cổ phiếu: Hỗ trợ cả thị trường forex và cổ phiếu, điều chỉnh phép tính dựa trên công cụ được giao dịch.
- Thiết lập trực quan: Vẽ các đường ngang trên biểu đồ cho điểm vào lệnh, dừng lỗ và chốt lời, cho phép biểu diễn trực quan dễ dàng của thiết lập giao dịch. Nó cũng hiển thị thông tin chính như giá vào lệnh, dừng lỗ, chốt lời, kích thước lot và loại giao dịch trực tiếp trên biểu đồ.
Cách hoạt động:
- Đầu vào: Người dùng thiết lập số tiền rủi ro (bằng USD), giá vào lệnh, giá mục tiêu và khoảng cách dừng lỗ (cố định hoặc dựa trên ATR). ATR (Average True Range) có thể được sử dụng để tính khoảng cách dừng lỗ trong các thị trường biến động.
- Tính toán: Script tự động tính kích thước vị thế bằng cách chia số tiền rủi ro cho khoảng cách dừng lỗ (tính bằng pip hoặc giá trị đô la, tùy thuộc vào việc đó là giao dịch forex hay cổ phiếu).
- Thông tin giao dịch: Hiển thị thông tin thời gian thực trên biểu đồ, như giá vào lệnh, dừng lỗ, chốt lời và kích thước lot cần thiết để duy trì mức rủi ro đã chỉ định.
Tính năng trực quan:
- Đường biểu đồ: Vẽ các mức vào lệnh, dừng lỗ và chốt lời dưới dạng các đường ngang trên biểu đồ.
- Chữ phủ: Hiển thị chi tiết giao dịch đã định dạng (rủi ro, vào lệnh, TP, SL, kích thước lot, v.v.) trên biểu đồ với vị trí chữ, màu sắc và kích thước font có thể tùy chỉnh.
Cách sử dụng:
- Chỉ báo này hữu ích cho các nhà giao dịch trong ngày, nhà giao dịch swing và scalper muốn tự động hóa quá trình tính kích thước vị thế dựa trên ngưỡng rủi ro đã xác định. Nó đơn giản hóa việc quản lý giao dịch bằng cách cung cấp các dấu hiệu trực quan và thông tin giao dịch trực tiếp trên biểu đồ, giúp đưa ra quyết định hiệu quả hơn.
Ví dụ:
- Một nhà giao dịch có thể đặt số tiền rủi ro là 50 đô la, giá vào lệnh là 100 đô la, và sử dụng ATR để tính dừng lỗ. Script sẽ tính toán kích thước vị thế tối ưu, vẽ các mức vào lệnh, dừng lỗ và chốt lời trên biểu đồ, và hiển thị các chi tiết quan trọng của giao dịch như số tiền rủi ro, dừng lỗ và lợi nhuận tiềm năng.
Công cụ này lý tưởng cho các nhà giao dịch ưu tiên quản lý rủi ro và muốn một cách tích hợp trực quan để quản lý các giao dịch của họ.
Tóm tắt
Hồ sơ chỉ báo
Đánh giá của khách hàng
5.0
Đánh giá: 1
5 | 100 % | |
4 | 0 % | |
3 | 0 % | |
2 | 0 % | |
1 | 0 % |
Đánh giá của khách hàng
April 29, 2025
it helps the review without running the trade, but it should stay as one part of the stack.
Thảo luận
Câu hỏi thường gặp
Forex
ATR
Các sản phẩm có sẵn trên cTrader Store, bao gồm bot giao dịch, chỉ báo và plugin, được cung cấp bởi các nhà phát triển bên thứ ba và chỉ nhằm mục đích cung cấp thông tin và tiếp cận kỹ thuật. cTrader Store không phải là nhà môi giới và không cung cấp lời khuyên đầu tư, khuyến nghị cá nhân hay bất kỳ đảm bảo nào về hiệu suất trong tương lai.
Sản phẩm khác của tác giả này


Giá
Kể từ 13/01/2025
2
Lượt bán