
Mô tả
Đây không chỉ là một robot RSI khác với các cài đặt ngẫu nhiên và các bài kiểm tra lại quá khớp.
Khi bạn mua cBot này, bạn cũng nhận được một gói phân tích đầy đủ, được xây dựng từ các bài kiểm tra định lượng quy mô lớn. Hơn 1 triệu tổ hợp tham số được thử nghiệm trên các biểu đồ Nhật Bản/Heiken Ashi/Renko
Chiến lược hoạt động như thế nào
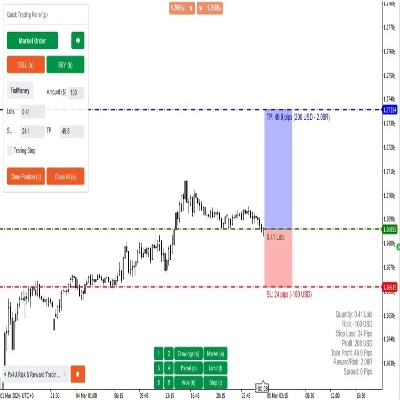
Vào lệnh mua
- Tín hiệu mua được kích hoạt khi RSI cắt lên trên một mức xác định:
(Ví dụ: Mức RSI là 29. Bây giờ là 31. Nó cắt lên trên mức 30. Ở đây cBot mở vị thế Mua)
Thoát lệnh mua
- Chốt lời (TP) — thoát khi cắt ngược lại
Thoát khi RSI cắt xuống dưới mức TP. Ví dụ: Mức RSI là 71. Bây giờ là 69. Nó cắt xuống mức 70. Ở đây cBot đóng vị thế Mua.
- Thoát bảo vệ — thoát khi cắt ngược lại (chỉ khi giao dịch có lợi nhuận)
Thoát khi RSI cắt xuống dưới mức Bảo vệ, nhưng chỉ khi vị thế hiện đang có lợi nhuận.
- Dừng lỗ (SL) — dừng theo mức RSI (không cần cắt)
Thoát ngay lập tức nếu Mức RSI chạm SL. Ví dụ: Vào vị thế Mua tại mức RSI 30, SL là 25. Khi RSI chạm 25, vị thế Mua sẽ đóng.
Ngược lại đối với vị thế Bán
Quản lý vị thế
- Robot chỉ giữ một vị thế duy nhất tại một thời điểm cho mỗi ký hiệu.
Thời điểm tín hiệu
- Tín hiệu được đánh giá chỉ sau khi một thanh đóng.
- Nếu có tín hiệu, lệnh vào được thực hiện tại MỞ của thanh tiếp theo (không đoán trong thanh và chúng ta có thể đánh giá chiến lược một cách chính xác).
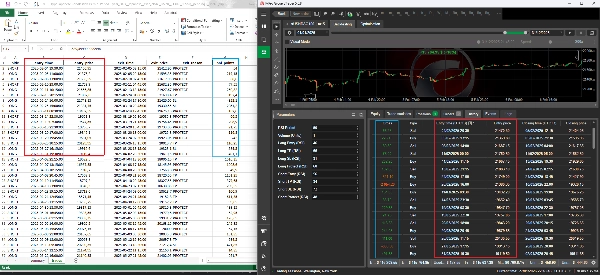
Cách tôi xác thực các cài đặt
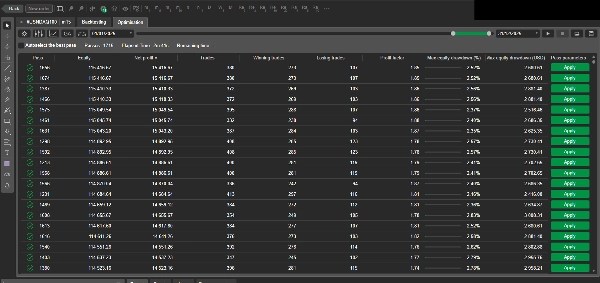
Tôi không “chọn tham số bằng mắt” hay chỉ dùng các giá trị ngẫu nhiên. Tôi thử nghiệm không gian tham số lớn bằng thuật toán di truyền (GA):
- Hàng ngàn tổ hợp tham số được đánh giá tự động
- Việc lựa chọn giữ lại sự đa dạng, không chỉ những người có hiệu suất tốt nhất (để giảm rủi ro tối ưu hóa quá mức)
- Thử nghiệm được thực hiện trên nhiều khoảng thời gian, khung thời gian, và loại biểu đồ (Nhật Bản / Heiken Ashi / Renko)
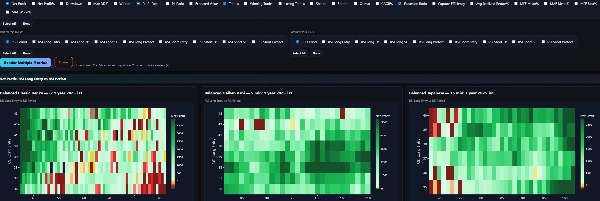
Điều này tạo ra một bộ dữ liệu lớn các kết quả và giúp xác định vùng tham số ổn định, không chỉ một cấu hình may mắn. Sau lần chạy GA đầu tiên, tôi thực hiện giai đoạn tối ưu hóa thứ hai tập trung vào các vùng tham số ổn định và có lợi nhất.
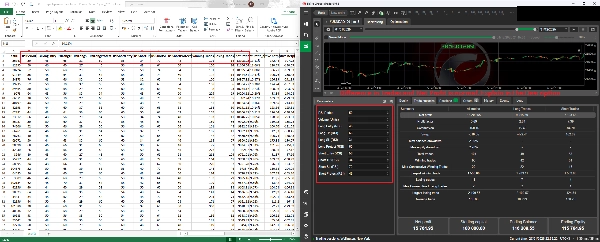
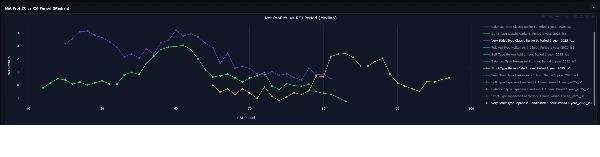
Các chỉ số (danh sách ngắn gọn)
Trong phân tích tôi theo dõi, ngoài ra còn có:
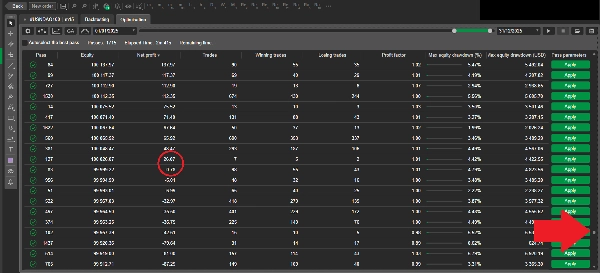
- Lợi nhuận ròng, Mức giảm tối đa
- Hệ số lợi nhuận, Tỷ lệ thắng, Giá trị kỳ vọng
- Sharpe, Sortino, Calmar
- MAE / MFE (biến động)
Kết quả GA của tôi và các bài kiểm tra lại trên cTrader có thể khác nhau một chút (và điều đó là bình thường)
Khi bạn so sánh kết quả tối ưu hóa di truyền (GA) của tôi với bài kiểm tra lại trên cTrader, bạn có thể nhận thấy sự khác biệt nhỏ về lợi nhuận, giá vào/ra, hoặc một vài chỉ số dẫn xuất.
Những khác biệt này là điều bình thường và xuất phát từ hai yếu tố được kiểm soát:
1) Đóng vị thế bắt buộc vào cuối bài kiểm tra (không có “giao dịch mở”)
Động cơ GA của tôi luôn đóng mọi vị thế mở tại thanh cuối cùng của cửa sổ kiểm tra. Điều này ngăn chặn các vị thế “kẹt” hoặc trôi nổi và làm cho kết quả được thực hiện đầy đủ và có thể so sánh giữa các lần chạy.
Trong cTrader, tùy thuộc vào cài đặt, một bài kiểm tra lại có thể:
- để vị thế mở vào cuối, hoặc
- đóng nó theo cách khác (thời điểm/giá), hoặc
- xử lý việc thực thi thanh cuối với cơ chế hơi khác.
Chỉ riêng điều này cũng có thể tạo ra sự khác biệt nhỏ trong vốn cuối cùng/lợi nhuận.
2) Ảnh hưởng của spread/trượt giá trong các đợt biến động mạnh
Thị trường thực (và các mô phỏng thực tế) có thể xuất hiện các đợt biến động đột ngột, trong đó:
- spread giãn rộng,
- trượt giá tăng,
- giá thực thi có sự khác biệt nhẹ.
Mô hình GA của tôi bao gồm spread + trượt giá tùy chọn + hoa hồng, và trong các đoạn biến động cao hiếm hoi, điều này có thể làm lệch giá khớp một chút. Ngay cả một sự thay đổi giá nhỏ cũng có thể làm thay đổi nhẹ các chỉ số như lợi nhuận ròng, mức giảm, hệ số lợi nhuận và các chỉ số khác
Mặc dù có những khác biệt nhỏ ở cấp độ thực thi này, hành vi và kết quả chiến lược vẫn có thể so sánh trực tiếp:
- các điểm vào/ra theo cùng một logic,
- các giao dịch xảy ra ở cùng khu vực,
- và các chỉ số hiệu suất chính vẫn đồng bộ.
Nếu bạn muốn:
- gói phân tích đầy đủ (T + bảng điều khiển tương tác),
- cài đặt được khuyến nghị cho tài sản/khung thời gian của bạn,
- hoặc nghiên cứu tùy chỉnh / phát triển chiến lược,
Liên hệ với tôi qua liên kết trong hồ sơ để nhận Phân tích
Tuyên bố từ chối trách nhiệm về rủi ro: Robot này chỉ dành cho mục đích giáo dục và nghiên cứu. Giao dịch có rủi ro, và hiệu suất trong quá khứ không đảm bảo kết quả trong tương lai.
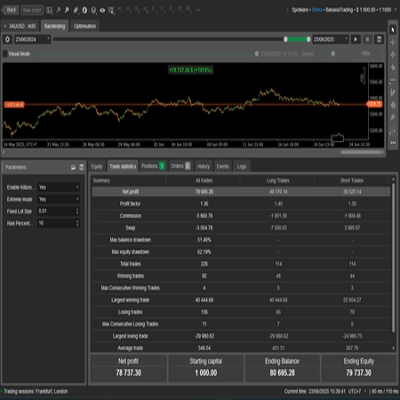
Tóm tắt
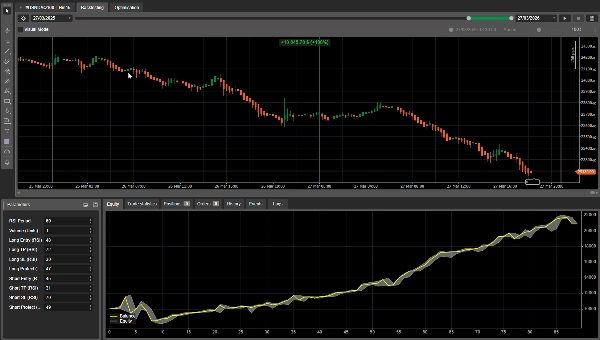
The robot manages one position per symbol at a time and evaluates signals only after bar close, executing trades at the next bar's open to avoid intrabar uncertainty. Parameter settings are optimized through extensive genetic algorithm testing, evaluating over one million parameter combinations across multiple periods, timeframes, and chart types to identify stable and profitable configurations. The package includes a full analytics suite tracking metrics such as net profit, max drawdown, profit factor, Sharpe ratio, and more.
Backtests use 100:1 leverage and market orders, with risk management via fixed lot sizing, take profit, and stop loss tools. Recommended minimum balance is $10,000 with 1% risk per trade and a maximum drawdown of 26.5%. The strategy targets low-frequency trades on instruments including BTCUSD, XAUUSD, NAS100, and indices.
Đánh giá của khách hàng
5 | 0 % | |
4 | 100 % | |
3 | 0 % | |
2 | 0 % | |
1 | 0 % |