
Description
R3.Alpha Analytics transforme votre historique de trading cTrader en un rapport de performance et de risque de qualité institutionnelle — automatiquement, sans saisie manuelle. Il lit vos trades clôturés et calcule une suite quantitative complète répartie sur dix onglets :
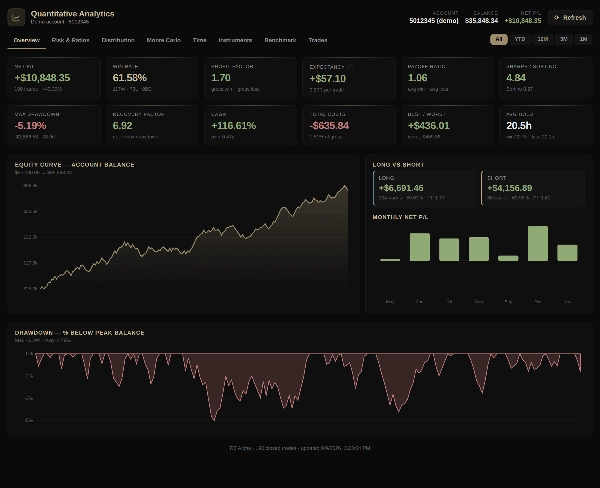
- Aperçu — P/L net, pourcentage de rendement total, rendement mensuel moyen, taux de réussite, facteur de profit, espérance, CAGR, drawdown maximal, courbe d'équité et répartition long vs short.
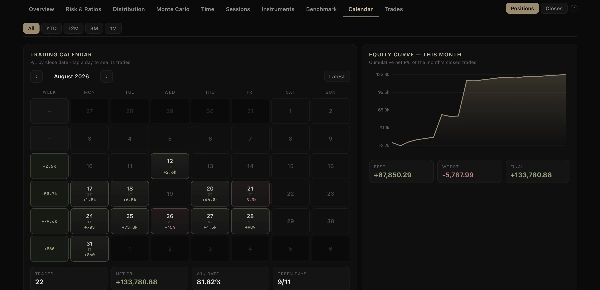
- Calendrier — un calendrier de trading P/L quotidien avec totaux hebdomadaires, une vue journalière accessible par clic et une vue d'ensemble annuelle.
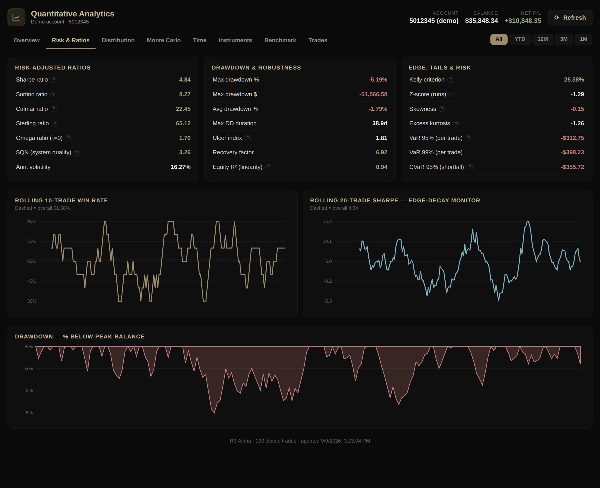
- Risque & Ratios — Sharpe, Sortino, Calmar, Sterling, Omega, SQN, VaR/CVaR, indice d'ulcère, facteur de récupération, taux de réussite glissant et Sharpe glissant.
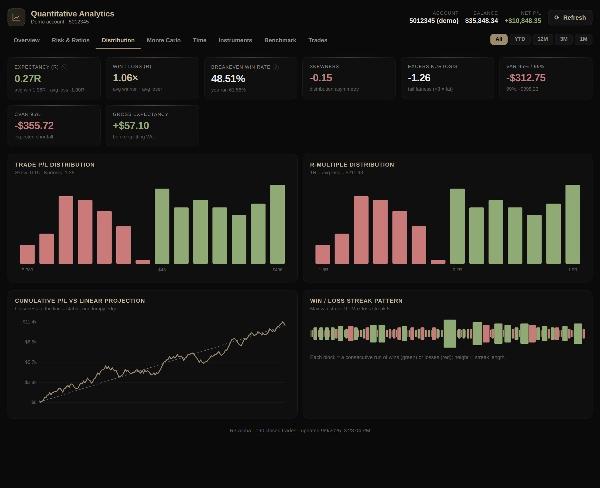
- Distribution — R-multiples, asymétrie, kurtosis, histogramme P/L et séries de gains/pertes.
- Monte Carlo — risque de ruine, probabilité de profit, drawdowns simulés et percentiles d'équité.
- Temps — performance par jour de la semaine, heure, mois et durée de détention.
- Sessions — sessions Asie, Londres, chevauchement Londres–NY et New York comparées par force et qualité, avec les paires les plus performantes dans chaque session.
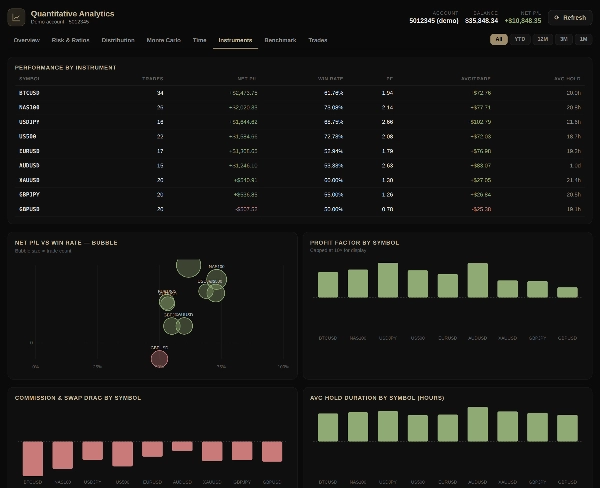
- Instruments — résultats, facteur de profit, coûts et durée de détention par symbole.
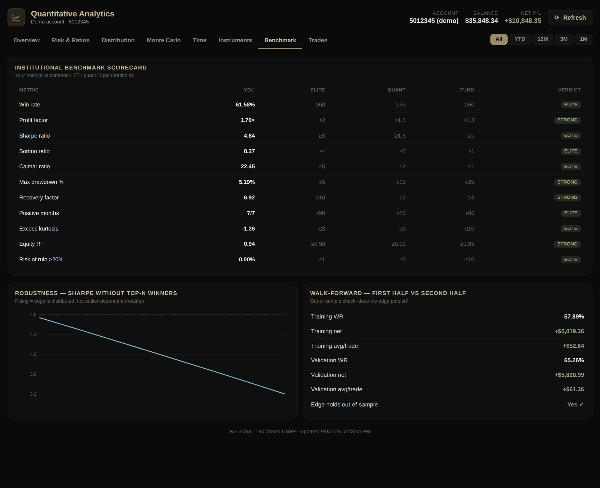
- Référence — un tableau de bord contre les seuils HFT, quant et fonds, avec validation en marche avant.
- Trades — le journal complet des trades avec prix d'entrée et de sortie, durée de détention, swaps et commissions.
Chaque graphique est interactif. Les filtres de période (Tous, YTD, 12M, 3M, 1M) recalculent chaque métrique selon les limites du calendrier, et un interrupteur Positions / Closes vous permet de compter chaque position comme un trade unique ou de correspondre aux statistiques propres à cTrader, où chaque clôture partielle est un trade distinct. Le plugin est strictement en lecture seule et ne passe jamais d'ordres. Utilisez-le pour auditer votre avantage, surveiller le drawdown et la cohérence, et voir exactement comment votre système performe.
Résumé
1. Overview: net profit/loss, win rate, profit factor, expectancy, CAGR, and drawdown.
2. Risk & Ratios: metrics such as Sharpe, Sortino, Calmar, Sterling, Omega, SQN, VaR/CVaR, Ulcer index, and recovery factor.
3. Distribution: analysis of R-multiples, skewness, kurtosis, and profit/loss histograms.
4. Monte Carlo simulations: risk of ruin, probability of profit, and equity percentiles.
5. Time and instrument breakdowns.
6. Benchmark scorecard: compares performance against high-frequency trading, quantitative, and fund thresholds with walk-forward validation.
7. Full trade log.
All charts are interactive with period filters that dynamically update metrics. The plugin operates in read-only mode and does not place trades. It is intended for auditing trading edge, monitoring drawdowns and consistency, and detailed system performance evaluation.
Avis clients
5 | 100 % | |
4 | 0 % | |
3 | 0 % | |
2 | 0 % | |
1 | 0 % |