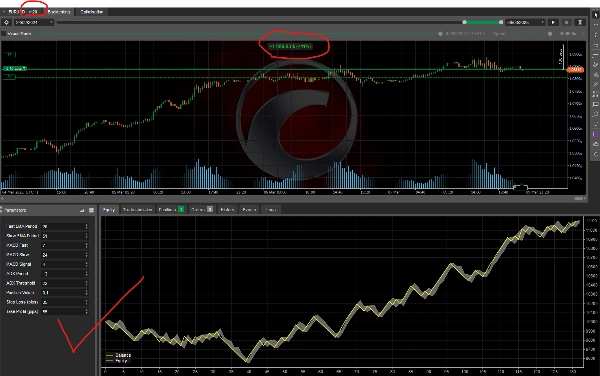
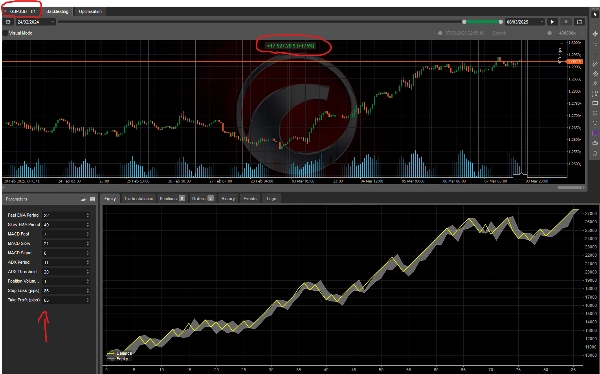
Description
Explication de la stratégie de suivi de tendance Forex (anglais)
Cette stratégie de suivi de tendance est conçue pour identifier les tendances fortes du marché en utilisant les moyennes mobiles exponentielles (EMA), le MACD et l'ADX. Elle génère des signaux d'achat et de vente basés sur le momentum et la force de la tendance.
Comment ça fonctionne
1️⃣ Identification de la direction de la tendance
- EMA rapide (21) et EMA lente (50) déterminent la direction générale de la tendance :
-
- Tendance haussière → EMA rapide est au-dessus de l'EMA lente
- Tendance baissière → EMA rapide est en dessous de l'EMA lente
2️⃣ Mesure du momentum de la tendance (Histogramme MACD)
- L'histogramme MACD confirme le momentum :
-
- Momentum haussier → L'histogramme MACD est au-dessus de zéro
- Momentum baissier → L'histogramme MACD est en dessous de zéro
3️⃣ Vérification de la force de la tendance (Indicateur ADX)
- L'ADX (14) mesure la force de la tendance :
-
- Tendance forte → L'ADX est au-dessus de 25
- Tendance faible → L'ADX est en dessous de 25 (pas de signaux)
Exécution des trades
✅ Signal d'achat (entrée haussière)
- EMA rapide > EMA lente (tendance haussière)
- Histogramme MACD > 0 (confirmation du momentum)
- ADX > 25 (tendance forte)
- 🔹 Flèche d'achat apparaît sous le prix le plus bas
❌ Signal de vente (entrée baissière)
- EMA rapide < EMA lente (tendance baissière)
- Histogramme MACD < 0 (confirmation du momentum)
- ADX > 25 (tendance forte)
- 🔻 Flèche de vente apparaît au-dessus du prix le plus haut
Caractéristiques clés
✔ Évite les tendances faibles grâce à l'ADX
✔ Filtre les faux signaux avec la confirmation du MACD
✔ Paramètres ajustables pour une meilleure personnalisation
Cet indicateur aide les traders à suivre les tendances fortes tout en évitant les conditions de marché faibles. 🚀
Résumé
Key components of the strategy include:
- Trend Direction: Determined by the relationship between a fast EMA (21) and a slow EMA (50). A bullish trend is indicated when the fast EMA is above the slow EMA; a bearish trend when it is below.
- Momentum Confirmation: The MACD histogram confirms momentum, with positive values indicating bullish momentum and negative values indicating bearish momentum.
- Trend Strength: The ADX (14) measures trend strength, with values above 25 signaling a strong trend suitable for trading; values below 25 indicate weak trends where no signals are generated.
Trade execution signals:
- Buy signals occur when the fast EMA is above the slow EMA, MACD histogram is positive, and ADX is above 25. A buy arrow appears below the low price.
- Sell signals occur when the fast EMA is below the slow EMA, MACD histogram is negative, and ADX is above 25. A sell arrow appears above the high price.
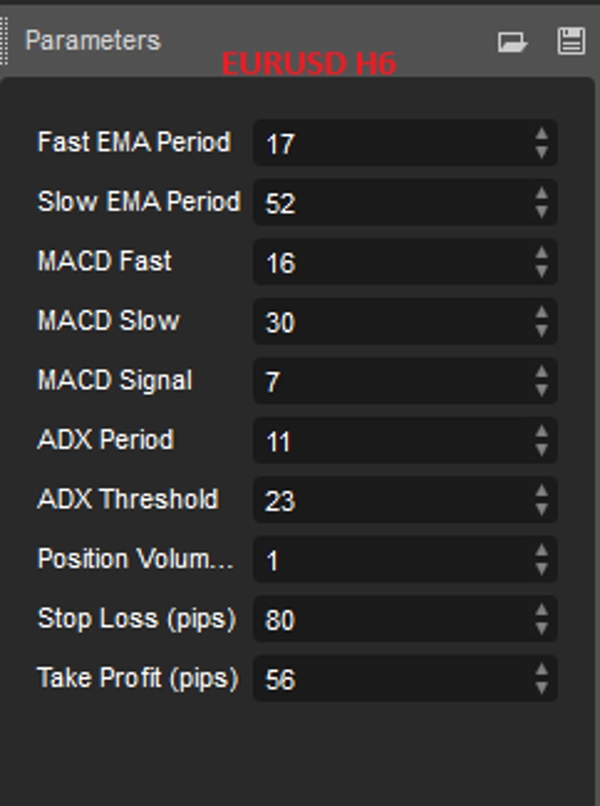
The bot features adjustable parameters for customization and aims to avoid weak trends and filter false signals, helping traders focus on strong market movements.
Discussion
Avis clients
5 | 0 % | |
4 | 100 % | |
3 | 0 % | |
2 | 0 % | |
1 | 0 % |