
الوصف
إليك صيغة حساب نقاط المحور القياسية:
PP = (High + Low + Close)/3
S1 = (PP * 2) – High
S2 = PP – (High – Low)
S3 = Low – 2(High – PP)
R1 = (PP * 2) – Low
R2 = PP + (High – Low)
R3 = High + 2(PP – Low)
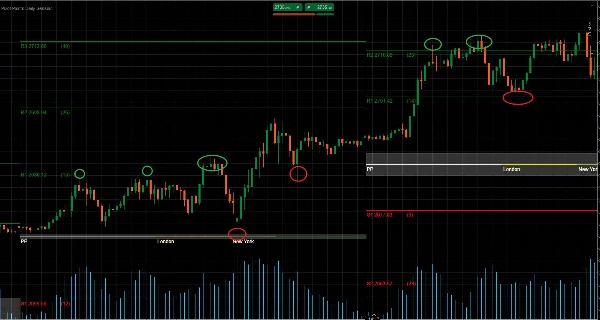
يمكن استخدام نقاط المحور لتحديد الاتجاه العام، حيث يشير التحرك عبر نقاط المحور إلى الأعلى إلى وجود اتجاه صاعد. في حين أن العكس، حيث يستمر السعر في الانخفاض تحت نقاط المحور خلال الجلسة، يدل على وجود اتجاه هابط.
في سوق متذبذب، يمكن للمتداولين ببساطة البيع (الذهاب قصيرًا) عند المقاومة والشراء (الذهاب طويلًا) عند الدعم. على سبيل المثال، إذا كان السوق محصورًا بين R1 و S1، فسيتم وضع أوامر الشراء حول S1، وأوامر البيع حول R1.
في سوق ذو اتجاه، ستعمل نقاط المحور ذات الصلة كنقاط مرجعية للأسواق التي تعيد التراجع لاستئناف الاتجاه الرئيسي. على سبيل المثال، إذا كانت الأسعار فوق PP خلال اتجاه صاعد ولكن تحت R2. يمكن للمتداولين النظر في وضع أوامر شراء مربحة حول R1.
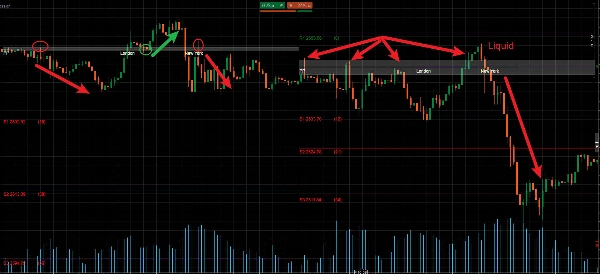
من المؤكد أن مستويات الدعم والمقاومة ستُكسر في بعض الأحيان في السوق. يمكن أن توفر فترات الاختراق هذه العديد من فرص التداول في السوق. يمكن أيضًا استخدام نقاط المحور لتداول اختراقات الأسعار المحتملة في السوق.
تحدث اختراقات الأسعار عندما يرتفع السعر من خلال مستوى دعم أو مقاومة موجود ويغير دوره بفعالية. على سبيل المثال، إذا حدث اختراق هابط عند S2، فإن خط المحور سيتوقف عن كونه خط دعم وسيُعتبر الآن خط مقاومة.
في هذا السيناريو، سيتم اعتبار أوامر البيع فقط تحت S2، ويمكن لخطوط المحور الأخرى توجيه وضع وقف الخسارة وجني الأرباح. يمكن وضع وقف الخسائر لأوامر البيع فوق S2 و S1، مع وضع أهداف الربح عند S3 وما دون.
中文说明:
枢轴点可用于识别整体趋势,因为价格向上突破枢轴点表明上升趋势。与此同时,相反的情况,即价格在交易时段内持续跌破枢轴点,则表明下降趋势。
在区间震荡市场中,交易者可以简单地在阻力位做空(卖出)和在支撑位做多(买入)。例如,如果市场在R1和S1之间波动,买单将放置在S1附近,卖单放置在R1附近。
在趋势市场中,相关的枢轴点将作为回调市场恢复主要趋势的参考点。例如,如果在上升趋势中价格高于PP但低于R2,交易者可以考虑在R1附近设置有利可图的买单。
支撑位和阻力位在某些市场情况下必然会被突破。这些突破期可以在市场中提供许多交易机会。枢轴点也可用于交易市场中潜在的价格突破。
价格突破发生在价格冲破现有的支撑位或阻力位并有效转换其角色时。例如,如果在S2处发生向下突破,该枢轴线将不再是支撑线,而将被视为阻力线。
在这种情况下,只有在S2下方才会考虑卖单,其他枢轴线可以指导止损和止盈的设置。卖单的止损可以设在S2和S1上方,盈利目标设在S3及以下。
الملخص
تقييمات العملاء
5 | 100 % | |
4 | 0 % | |
3 | 0 % | |
2 | 0 % | |
1 | 0 % |


