
Mô tả
Cấu trúc phạm vi mở cửa qua bất kỳ khoảng thời gian nào—phiên trong ngày đến chu kỳ hàng năm—với các mức Fibonacci và dự báo mở rộng.
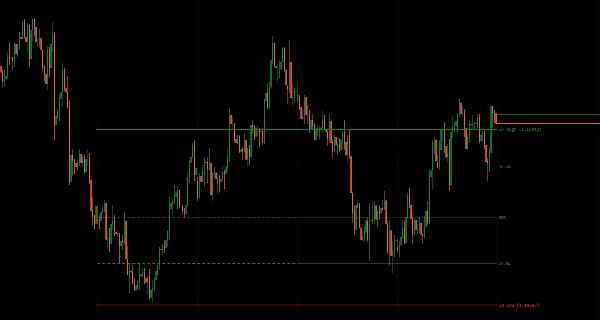
Đánh dấu phạm vi Cao/Thấp được thiết lập trong các khoảng thời gian mở cửa (Hàng ngày, Hàng tuần, Hàng tháng, Hàng quý, Hàng năm hoặc Phạm vi Tùy chỉnh) làm tham chiếu cho các đột phá, hồi quy trung bình và kỳ vọng biến động.
Tám loại khoảng thời gian với phát hiện phiên có nhận biết múi giờ (Sydney/Tokyo/London/NY), bù lịch sử cho so sánh đa kỳ, tùy chọn bảy mức Fibonacci (11,4% đến 88,6%) bên trong phạm vi IB, dự báo lên/xuống từ các ranh giới, kiểm soát mở rộng đường linh hoạt (chỉ kỳ IB, thanh hiện tại hoặc N kỳ về phía trước), và phát hiện kỳ chính xác cung cấp phân tích phạm vi mở cửa toàn diện cho các nhà giao dịch nhắm đến các thiết lập dựa trên cấu trúc trên tất cả các khung thời gian.
TÍNH NĂNG
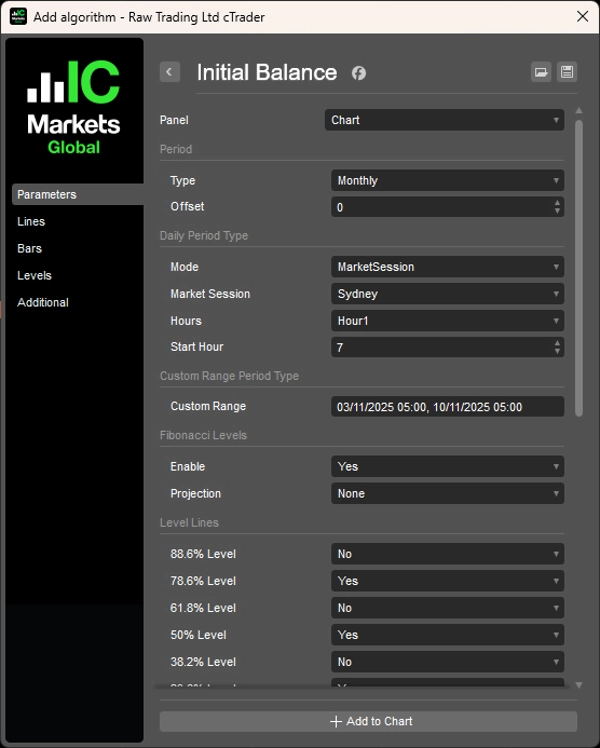
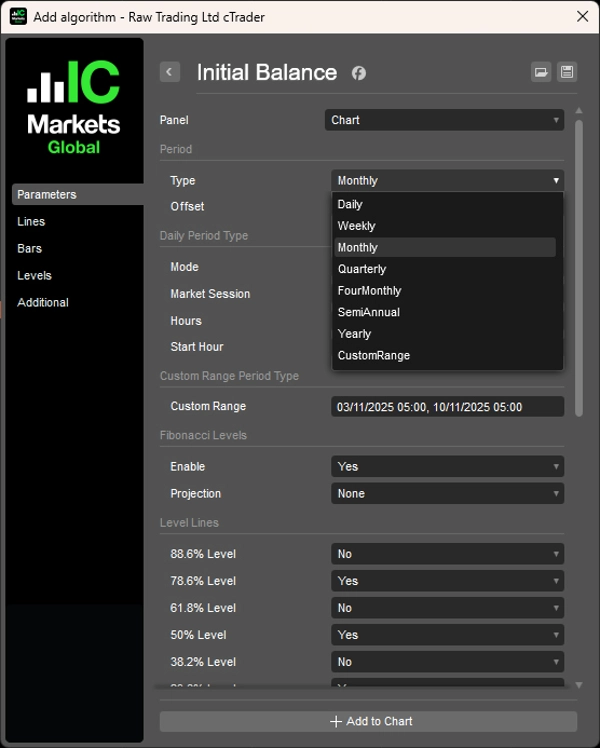
8 Loại Khoảng Thời Gian
- Hàng ngày, Hàng tuần, Hàng tháng, Hàng quý, 4 tháng, Nửa năm, Hàng năm, Phạm vi Tùy chỉnh
- Chế độ hàng ngày: Dựa trên giờ (1-12 giờ) hoặc Phiên thị trường (Sydney/Tokyo/London/NY)
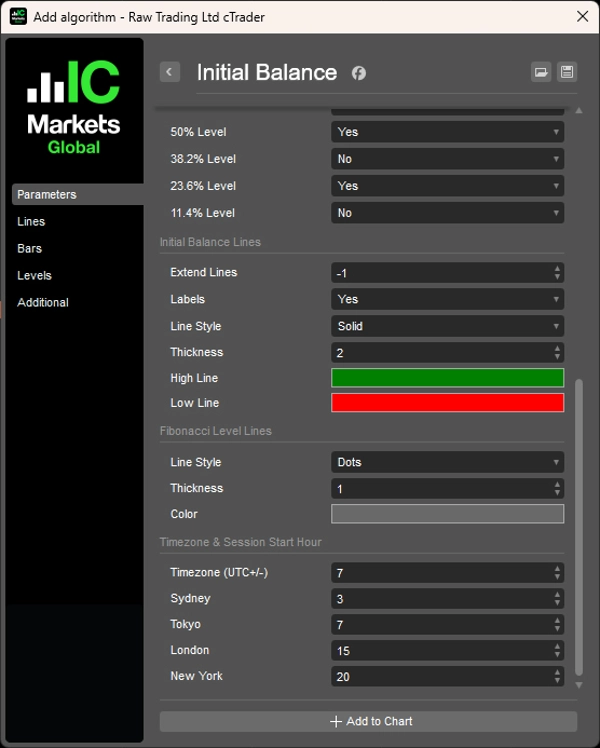
- Thời gian bắt đầu phiên có thể cấu hình với điều chỉnh bù UTC nhận biết múi giờ
- Phạm vi Tùy chỉnh: Xác định chính xác ngày giờ bắt đầu/kết thúc cho phân tích dựa trên sự kiện
Các Khoảng Thời Gian Lịch Sử
- Tham số bù để xem các phạm vi IB trước đây (ví dụ: IB tuần trước, IB tháng trước)
- So sánh hành động giá hiện tại với cấu trúc kỳ trước
- Phân tích đa kỳ để xác nhận xu hướng
Các Mức Fibonacci
- Tùy chọn 7 mức (11,4%, 23,6%, 38,2%, 50%, 61,8%, 78,6%, 88,6%) bên trong phạm vi IB
- Các vùng hồi quy trung bình trong phạm vi cân bằng
- Điểm tham chiếu vào/ra chính xác
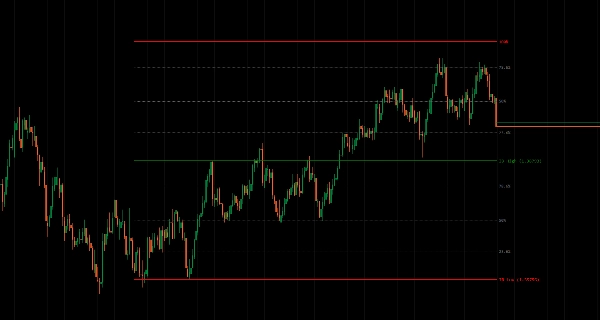
Dự Báo Fibonacci
- Dự báo các mức lên/xuống từ cao/thấp IB
- Mục tiêu đột phá tiềm năng vượt ra ngoài phạm vi
- Vùng mở rộng cho các chuyển động theo hướng
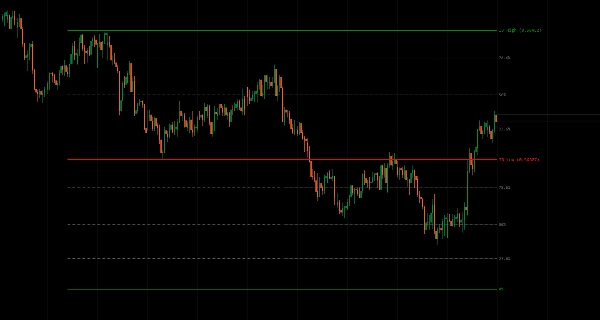
Kiểm Soát Mở Rộng Đường
- Chỉ kỳ IB: Hiển thị phạm vi trong kỳ hình thành
- Thanh hiện tại: Mở rộng đến hiện tại
- N kỳ về phía trước: Dự báo vào tương lai để lập kế hoạch
- Quản lý hình ảnh sạch sẽ
Phát Hiện Kỳ Chính Xác
- Tính toán phạm vi mở cửa chính xác cho từng loại kỳ
- Nhận biết múi giờ cho các thị trường toàn cầu
- Xử lý trùng lặp và chuyển đổi phiên một cách sạch sẽ
__________________________________________________________________________________________
NHIỀU CHỈ BÁO MIỄN PHÍ HƠN
Khám phá nhiều công cụ phân tích thị trường—từ cấu trúc và khối lượng đến hồi quy, biến động và khung thời gian tùy chỉnh.
Mã nguồn có sẵn trên kho lưu trữ GitHub repository.
Tất cả đều miễn phí sử dụng. Nhưng nếu bạn muốn gửi hỗ trợ cà phê, bạn có thể chuyển đến đây.
Hỗ Trợ/Kháng Cự
Khối Lượng
- Volume Activity Profiler
- Volume Efficiency Analyzer
- Volume Profile Analytics
- Volume Profile - Updated
- Volume Spread Analysis
- VWAP (Volume Weighted Average Price)
Đường Trung Bình Động
- SSL Channel
- Anchored Moving Average
- Deviation-Scaled Moving Average
- Gann High Low Activator
- Instantaneous Trendline
- Kaufman Adaptive MA with Trend Vision
- Moving Average Channel
- Moving Averages Suite
- Trend Channel Moving Average
Tiện Ích/Tùy Chỉnh
Dựa Trên Hồi Quy
Biến Động
Bộ Dao Động
__________________________________________________________________________________________
TỪ CHỐI TRÁCH NHIỆM
Giao dịch có rủi ro. Chỉ báo này chỉ dành cho phân tích kỹ thuật — luôn áp dụng quản lý rủi ro phù hợp và giao dịch có trách nhiệm.
PHẢN HỒI & CẢI TIẾN
Nếu bạn có đề xuất, yêu cầu tính năng hoặc ý tưởng cải tiến, vui lòng để lại bình luận trong tab Thảo luận. Phản hồi của bạn giúp cải thiện chỉ báo cho mọi người.
Tóm tắt
Key features include configurable session start times with UTC offset adjustments, historical offset parameters for comparing past initial balance ranges, and multi-period analysis for trend confirmation. It offers optional Fibonacci retracement levels (11.4% to 88.6%) within the initial balance range to highlight mean reversion zones and precise entry or exit points. Additionally, Fibonacci projections extend upward or downward from the initial balance boundaries to indicate potential breakout targets and directional extension zones.
Line extension controls allow users to display the range during its formation, extend it to the current bar, or project it forward for planning purposes. The indicator ensures precise period detection, handling session overlaps and transitions accurately for global market analysis. This tool aids traders in identifying breakout, mean reversion, and volatility expectations based on opening range structures across all timeframes.
Đánh giá của khách hàng
5 | 50 % | |
4 | 50 % | |
3 | 0 % | |
2 | 0 % | |
1 | 0 % |


![Logo "[Hamster-Coder] Bollinger Bands"](https://cdn.ctrader.com/image/webp/21d8e5d6-fb11-4bac-b9ee-cd05c2b76804_30327)


