Description
Lock moving average calculation to any market moment and track price behavior as it extends forward.
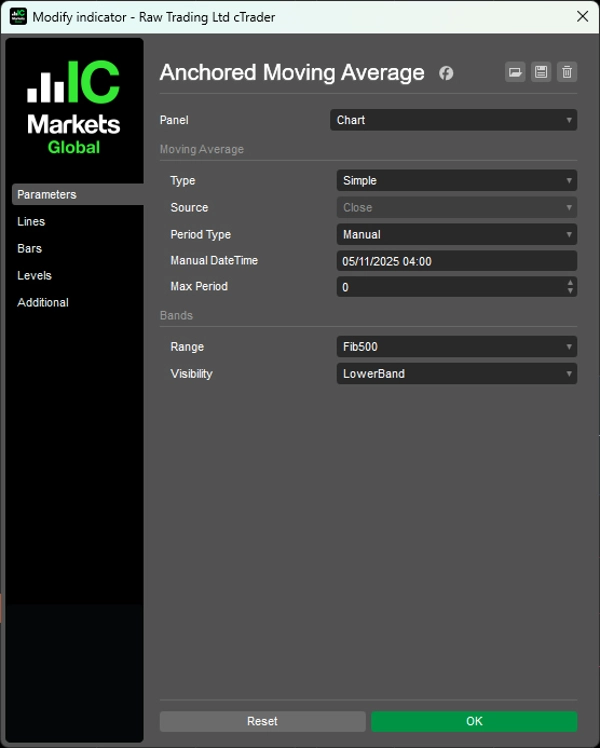
Pins calculation to your chosen starting point (manual datetime or lookback period from 1 hour to 10 years), then grows naturally with adaptive Fibonacci bands based on actual price range.
Eight Fibonacci levels (11.4% to 100%) that adapt to real price movement, built-in 38.2%-62.8% mean reversion zone, dual MA types (SMA/EMA), multiple display modes (full bands, extreme boundaries only, reversion zone only), and max period limiter for long timeframes deliver event-based momentum tracking for traders targeting pullbacks from significant swing points and post-event price behavior analysis.
FEATURES
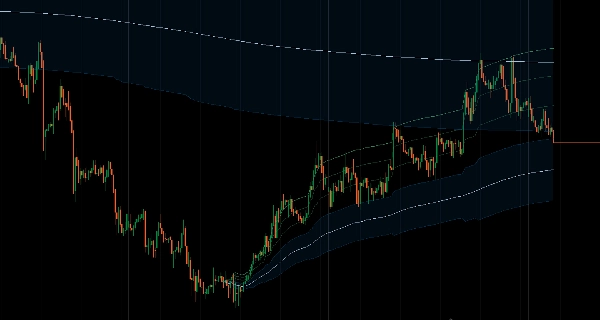
Time-Anchored Calculation
- Unlike standard MAs that use fixed periods, this grows naturally from your chosen starting point
- Flexible anchoring: Set manual datetime or use pre-defined lookback periods (1 hour to 10 years)
- Track momentum from significant market moments
- Consistent anchor points across different timeframes
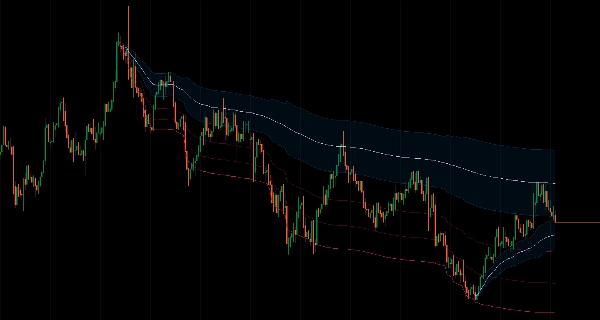
Adaptive Fibonacci Bands
- Automatically calculated bands based on actual price range, not arbitrary ATR multiples
- 8 Fibonacci levels (11.4% to 100%) that adapt to real price movement
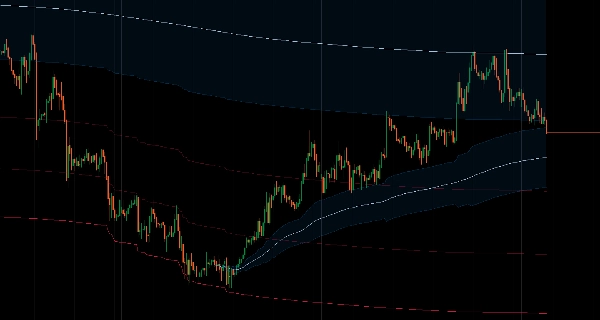
- Mean reversion zones: Built-in 38.2%-62.8% reversion zone for high-probability entry areas
- Mathematically-defined probability zones
Two MA Types
- Simple Moving Average
- Exponential Moving Average
- Max period limiter: Prevent over-smoothing on long timeframes
Multiple Display Modes
- Full bands: All Fibonacci levels visible
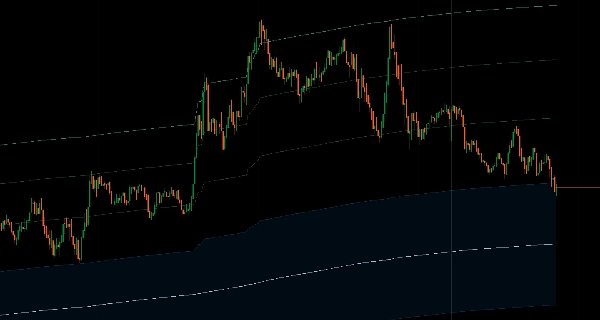
- Upper/lower only: Show extreme boundaries
- Reversion zone only: Focus on mean reversion area
- Clean, purposeful design with no clutter
Event-Based Analysis
- See how current price relates to movement from significant levels
- Track post-event price behavior
- Structure-based entries with clear reference points
__________________________________________________________________________________________
MORE FREE INDICATORS
Explore a wide range of market analysis tools—from structure and volume to regression, volatility, and custom timeframes.
Source code is available on GitHub repository.
All free to use. But if you feel like sending coffee support, you can route it here.
Support/Resistance
Volume
- Volume Activity Profiler
- Volume Efficiency Analyzer
- Volume Profile Analytics
- Volume Profile - Updated
- Volume Spread Analysis
- VWAP (Volume Weighted Average Price)
Moving Averages
- SSL Channel
- Anchored Moving Average
- Deviation-Scaled Moving Average
- Gann High Low Activator
- Instantaneous Trendline
- Kaufman Adaptive MA with Trend Vision
- Moving Average Channel
- Moving Averages Suite
- Trend Channel Moving Average
Utilities/Custom
Regression-Based
Volatility
Oscillators
__________________________________________________________________________________________
DISCLAIMER
Trading involves risk. This indicator is intended for technical analysis only — always apply proper risk management and trade responsibly.
FEECBACK & IMPROVEMENTS
If you have suggestions, feature requests, or ideas for enhancement, please leave a comment in the Discussion tab. Your feedback helps improve the indicator for everyone.
Summary
The indicator features adaptive Fibonacci bands calculated based on the actual price range, not arbitrary multiples. It includes eight Fibonacci levels from 11.4% to 100%, with a built-in mean reversion zone between 38.2% and 62.8%, providing mathematically defined probability zones for potential entry areas. Multiple display modes are available, including full bands, extreme boundaries only, or reversion zone only, designed for a clean and purposeful chart presentation.
This tool facilitates analysis of price behavior relative to significant swing points or events, supporting structured entries and post-event price tracking. It is intended for technical analysis and includes a disclaimer advising responsible trading with proper risk management.
Customer reviews
5 | 100 % | |
4 | 0 % | |
3 | 0 % | |
2 | 0 % | |
1 | 0 % |