
Description
OVERVIEW
Volume Spread Analysis (VSA) is a methodology developed by Tom Williams, a former syndicate trader, based on the work of Richard Wyckoff from the early 1900s. VSA interprets the relationship between volume, price spread (range), and close location to identify supply and demand imbalances.
Key VSA Concepts:
- Volume shows the amount of activity - who's participating
- Spread shows volatility and uncertainty - how far price moved
- Close Location shows who won the bar - buyers or sellers
- Context shows where we are in the market cycle - strength or weakness phase
When volume increases with wide spread but little price progress, it suggests absorption (one side soaking up the other's pressure). When volume decreases with narrow spread in a trend, it suggests lack of participation (potential weakness).
This Implementation:
This indicator quantifies VSA concepts using statistical methods. It differs from traditional VSA in several ways:
- Uses
(close - open) / rangeas an efficiency metric (not in original VSA) - Absorption patterns identify "one side winning" rather than traditional "pressure absorption"
- ENR (Effort No Result) is quantified using efficiency threshold; original VSA is more interpretive
- Uses trimmed mean for volume averaging (outlier-resistant) and percentile ranking for spread
- Does not include: Stopping Volume, Upthrust, Test, Shakeout patterns
This is a quantified, algorithmic approach to VSA concepts. Traditional VSA is more interpretive and context-dependent. Use this indicator as one analytical tool among many, not as standalone signals.
WHAT THIS INDICATOR DOES
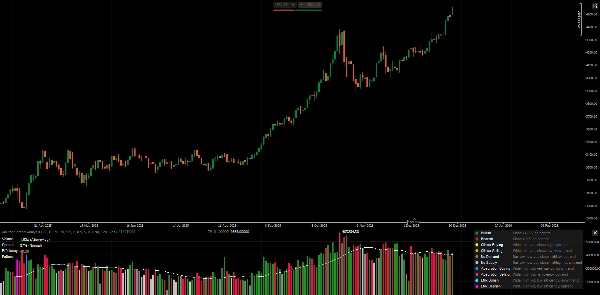
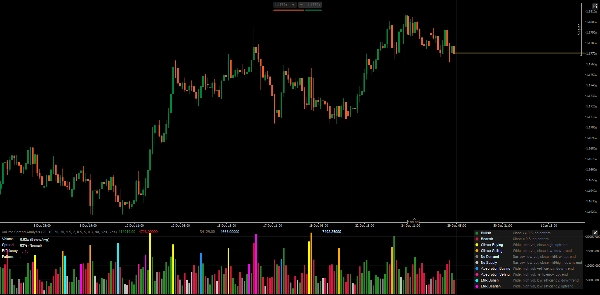
Analyzes each bar's volume, spread, and close location to detect potential supply/demand imbalances. Displays volume histogram colored by pattern type, with real-time metrics panel.
PATTERN DEFINITIONS
1. Standard Bars (No Pattern)
- Bullish: Close ≥ 0.5 in range, no special pattern detected
- Bearish: Close < 0.5 in range, no special pattern detected
2. Climax Patterns (Potential Exhaustion)
- Climax Buying: Wide spread + ultra-high volume + close high + in uptrend
- Interpretation: Possible buying exhaustion, watch for reversal
- Climax Selling: Wide spread + ultra-high volume + close low + in downtrend
- Interpretation: Possible selling exhaustion, watch for reversal
3. Weak Patterns (Lack of Conviction)
- No Demand: Narrow spread + low volume + close mid/low + in uptrend
- Interpretation: Buyers not supporting rally, potential weakness
- No Supply: Narrow spread + low volume + close mid/high + in downtrend
- Interpretation: Sellers not pushing lower, potential strength
4. Absorption Patterns (One Side Winning)
- Absorption Buying: Wide spread + high volume + positive efficiency + in downtrend
- Interpretation: Buyers absorbing selling pressure, potential reversal up
- Absorption Selling: Wide spread + high volume + negative efficiency + in uptrend
- Interpretation: Sellers absorbing buying pressure, potential reversal down
5. ENR Patterns (Effort Without Clear Result)
- ENR Bullish: Wide spread + high volume + low efficiency + in downtrend
- Interpretation: High effort but no clear winner, potential support/indecision
- ENR Bearish: Wide spread + high volume + low efficiency + in uptrend
- Interpretation: High effort but no clear winner, potential resistance/indecision
METRICS PANEL EXPLAINED
Volume
- Shows current bar volume as ratio to trimmed mean (e.g., "1.85x")
- Classification: Low / BelowAvg / AboveAvg / High / UltraHigh
- High volume = market participation, but context matters
Spread
- Shows percentile rank (0-100%) relative to recent bars
- Classification: Narrow / Normal / Wide
- Wide spread = volatility/uncertainty, not necessarily direction
Efficiency
- Formula:
(close - open) / (high - low) - Range: -1.0 to +1.0
- Positive = bullish body dominates range
- Negative = bearish body dominates range
- Near zero = small body, high wick, indecision
Pattern
- Current detected pattern (or "-" if none)
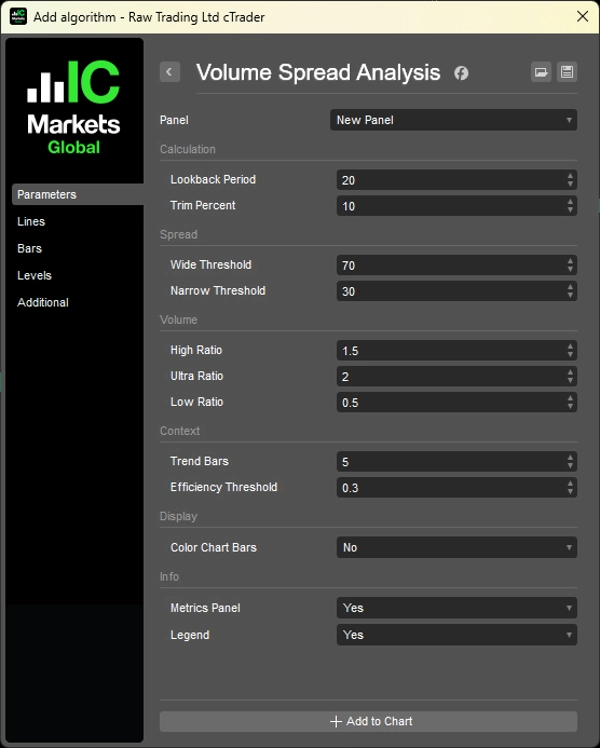
PARAMETERS
1. Calculation
- Lookback Period (20): Bars used for volume/spread statistics
- Trim Percent (10%): Removes outliers from volume calculation
2. Spread Classification
- Wide Threshold (70%): Percentile to classify as "wide"
- Narrow Threshold (30%): Percentile to classify as "narrow"
3. Volume Classification
- High Ratio (1.5x): Above average threshold
- Ultra Ratio (2.0x): Ultra-high threshold
- Low Ratio (0.5x): Below average threshold
4. Context
- Trend Bars (5): Bars back to compare for trend direction
- Efficiency Threshold (0.3): Minimum for "strong" efficiency
5. Display
- Color Chart Bars: Apply pattern colors to price chart
- Metrics Panel: Show real-time metrics
- Legend: Show pattern reference guide
HOW TO USE
1. Don't use patterns as direct trade signals - they indicate potential context, not entries.
2. Combine with price structure - VSA works best confirming what price structure shows.
3. Watch for context - same pattern can mean different things at support vs resistance.
4. Volume perspective matters - high volume absorption at key level > random bar absorption.
Forex Volume Limitation
Forex spot market shows tick volume (number of price changes), not actual traded contracts. Patterns may be less reliable than in futures/stocks with true volume data.
LEGEND (Built-in Reference)
Enable "Legend" parameter to display pattern descriptions directly on chart.
__________________________________________________________________________________________
MORE FREE INDICATORS
Explore a wide range of market analysis tools—from structure and volume to regression, volatility, and custom timeframes.
Source code is available on GitHub repository.
All free to use. But if you feel like sending coffee support, you can route it here.
Support/Resistance
Volume
- Volume Activity Profiler
- Volume Efficiency Analyzer
- Volume Profile Analytics
- Volume Profile - Updated
- Volume Spread Analysis
- VWAP (Volume Weighted Average Price)
Moving Averages
- SSL Channel
- Anchored Moving Average
- Deviation-Scaled Moving Average
- Gann High Low Activator
- Instantaneous Trendline
- Kaufman Adaptive MA with Trend Vision
- Moving Average Channel
- Moving Averages Suite
- Trend Channel Moving Average
Utilities/Custom
Regression-Based
Volatility
Oscillators
__________________________________________________________________________________________
DISCLAIMER
Trading involves risk. This indicator is intended for technical analysis only — always apply proper risk management and trade responsibly.
FEECBACK & IMPROVEMENTS
If you have suggestions, feature requests, or ideas for enhancement, please leave a comment in the Discussion tab. Your feedback helps improve the indicator for everyone.
Summary
This implementation quantifies VSA concepts using statistical methods, including an efficiency metric defined as (close - open) / range, trimmed mean volume averaging, and percentile ranking for spread. It identifies several bar patterns: Standard (bullish/bearish), Climax (buying/selling exhaustion), Weak (No Demand/No Supply), Absorption (one side winning), and ENR (Effort No Result), each indicating different market conditions.
The indicator displays a volume histogram colored by detected pattern type and provides a real-time metrics panel showing volume ratio, spread percentile, efficiency, and current pattern. Parameters allow customization of lookback periods, volume/spread thresholds, and display options such as coloring chart bars and showing a pattern legend.
VSA is applicable across markets including Forex, stocks, indices, commodities, and crypto. Note that Forex volume reflects tick volume, which may affect pattern reliability. The indicator is designed as an analytical tool to complement price structure analysis rather than as standalone trade signals.
Customer reviews
5 | 100 % | |
4 | 0 % | |
3 | 0 % | |
2 | 0 % | |
1 | 0 % |


