
Area of Interest
Indicator
2 purchases
Version 1.0, Aug 2025
Windows, Mac
4.0
Reviews: 2
Description
1. Purpose of the Indicator
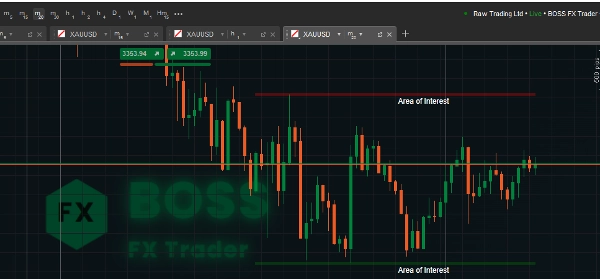
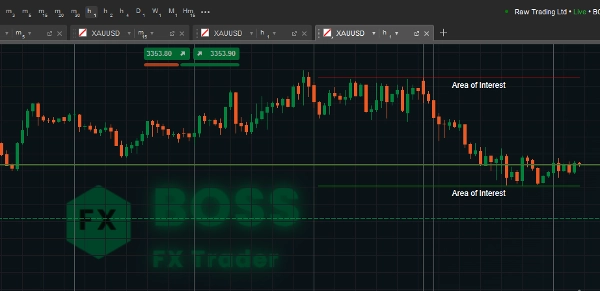
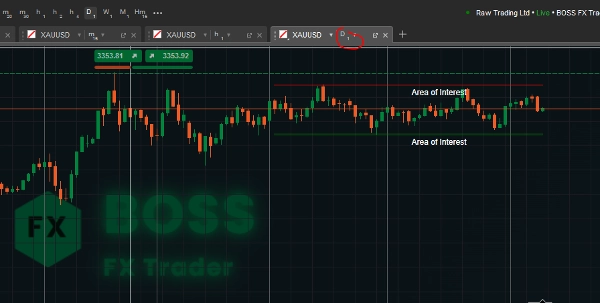
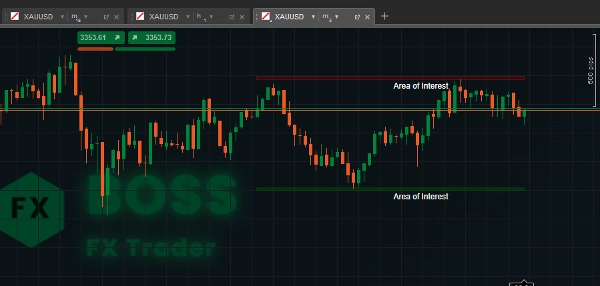
This Area of Interest cTrader indicator identifies support and resistance zones within a user-defined lookback period, and visually highlights them as “Areas of Interest” on your chart.
It helps traders quickly see key price levels where reversals or breakouts are more likely to occur.
2. How the Code Works
- Lookback Period – The number of previous bars (candles) the indicator will scan to find the highest high and lowest low.
- Higher values → broader zones.
- Lower values → more recent levels.
- Zone Height – The vertical size (thickness) of the support/resistance area in pips.
- Helps make the zone more visible and adjustable.
- Clears old drawings before plotting new ones to avoid clutter.
- Collects high and low prices for the lookback range.
- Finds the highest and lowest price levels (resistance & support).
- Converts zone height from pips to actual price value.
3. Usage Instructions
- Attach the Indicator
- Open cTrader, load a chart, click Indicators → Custom → AreaOfInterest.
- Adjust Parameters
- Lookback Period:
- For swing trading → Use larger values (e.g., 100–200).
- For scalping → Use smaller values (e.g., 20–50).
- Zone Height: Adjust to your trading style and instrument volatility.
- Interpreting the Zones
- Red Zone (Resistance) – Price tends to reverse or slow down when entering this zone.
- Green Zone (Support) – Price often bounces upward from here.
- Look for:
- Price rejection
- Candlestick patterns (pin bars, engulfing)
- Confluence with other indicators (EMA, RSI, Fibonacci)
- Trading Examples
- Bounce Trade: Enter long near the green zone with a stop just below it.
- Breakout Trade: Wait for prices to close above the red zone for a bullish breakout.
- False Break Detection: Watch for wicks beyond the zone but closed inside (possible reversals).
A profitable trader used this tool.
Summary
AI summary
Area of Interest is a cTrader indicator designed to identify and visually highlight key support and resistance zones on trading charts. It scans a user-defined lookback period to detect the highest highs and lowest lows, marking these as “Areas of Interest” to help traders recognize price levels where reversals or breakouts are more likely. Users can adjust the lookback period to focus on broader historical zones or more recent price levels, and set the vertical size (zone height) of these areas in pips for better visibility. The indicator clears previous drawings before plotting new zones to maintain chart clarity. Resistance zones are displayed in red, indicating potential price reversals or slowdowns, while support zones appear in green, suggesting possible price bounces. Traders can use these zones alongside price action signals such as candlestick patterns and other technical indicators to inform trading decisions. Typical applications include entering long positions near support zones, trading breakouts above resistance zones, and detecting false breakouts by observing price wicks relative to the zones. The indicator supports customization to suit different trading styles, including scalping and swing trading, by adjusting the lookback period and zone height parameters.
Indicator profile
Customer reviews
4.0
Reviews: 2
5 | 0 % | |
4 | 100 % | |
3 | 0 % | |
2 | 0 % | |
1 | 0 % |
Discussion
FAQ
Products available through cTrader Store, including trading bots, indicators and plugins, are provided by third-party developers and made available for informational and technical access purposes only. cTrader Store is not a broker and does not provide investment advice, personal recommendations or any guarantee of future performance.


Price
Since 29/05/2025
3.04M
Traded volume
45.22K
Pips won
29
Sales
771
Free installs