
Zigzag Trend
Indicator
2 purchases
Version 1.0, Sep 2025
Windows, Mac
4.6
Reviews: 3
Description
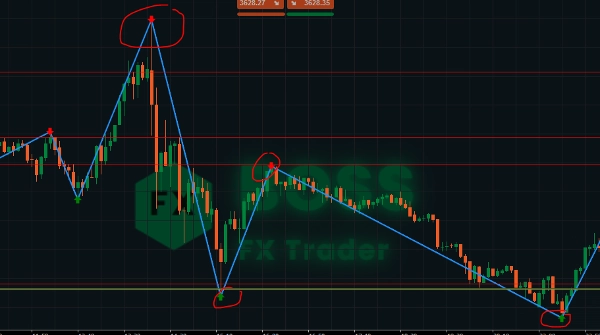
The ZigZag Indicator is a market structure tool that filters out small price fluctuations and highlights major swing highs and lows. By connecting these points with lines, traders can easily identify trends, reversals, and chart patterns.
It does not generate buy/sell signals by itself, but when combined with price action, support/resistance, or other indicators, it becomes powerful for scalping, intraday, and swing strategies.
🔎 Key Features
- Simplifies market noise by showing clear price swings.
- Helps identify support and resistance levels.
- Useful for spotting chart patterns (head & shoulders, double tops/bottoms, triangles).
- Assists in trend confirmation and pullback entries.
- Arrow Sell and Buy indicator
⚡ Scalping with ZigZag
- Timeframes: 1m – 5m
- Goal: Catch small but frequent moves.
- How to Use:
- Wait for a new swing high/low to form.
- Mark these as micro-support or resistance.
- Enter trades on breakouts or pullbacks to these ZigZag levels.
- Keep stop-loss just beyond the last swing (tight risk).
- Aim for quick TP (5–15 pips depending on volatility).
👉 Works best in high volatility sessions (London / New York open).
⏱️ Intraday Trading with ZigZag
- Timeframes: 15m – 1H
- Goal: Trade daily trends and key intraday reversals.
- How to Use:
- Identify the main intraday trend using higher ZigZag swings.
- Use ZigZag points as pivot zones for entry (buy dips in uptrend, sell rallies in downtrend).
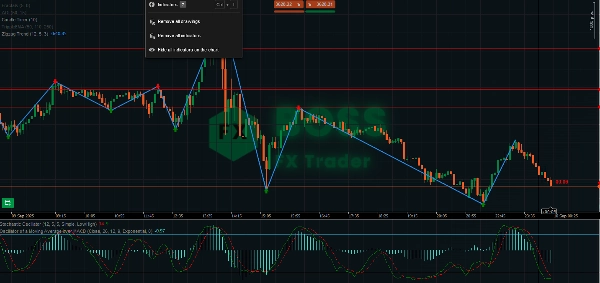
- Combine with oscillators (RSI/Stochastic) to confirm overbought/oversold near ZigZag extremes.
- Use previous swing high/low as logical SL/TP levels.
👉 Great for day traders who want 20–50 pip moves.
📆 Swing Trading with ZigZag
- Timeframes: 4H – Daily
- Goal: Catch large trend moves and position trades.
- How to Use:
- Use ZigZag to identify major market structure (higher highs & higher lows = uptrend).
- Enter after pullbacks when a new swing low forms in an uptrend.
- Place SL below last major swing low.
- Target 2–3x risk, or next ZigZag swing level.
- Use ZigZag to spot reversal patterns (double top/bottom, head & shoulders) for exits.
👉 Ideal for holding trades for days to weeks.
📌 Pro Tips
- Adjust Depth: Smaller = more sensitive (good for scalping). Larger = filters noise (better for swing).
- Combine with volume, trend filters, or moving averages for confirmation.
- Always check higher timeframe ZigZag before entering — small swings inside a bigger trend can be traps.
- Use ZigZag for chart pattern validation (triangles, wedges).
Stay profitable traders!
Summary
AI summary
The ZigZag Trend indicator is a market structure tool designed to filter out minor price fluctuations and emphasize major swing highs and lows. By connecting these significant points with lines, it helps traders identify trends, reversals, and chart patterns such as head & shoulders, double tops/bottoms, and triangles. The indicator itself does not generate buy or sell signals but can be combined with price action, support/resistance levels, or other indicators like RSI and MACD to enhance scalping, intraday, and swing trading strategies.
Key features include simplification of market noise, identification of support and resistance levels, trend confirmation, and assistance with pullback entries. It supports multiple trading styles across various timeframes: scalping (1–5 minutes), intraday trading (15 minutes to 1 hour), and swing trading (4 hours to daily). Users can adjust the indicator’s sensitivity to suit different trading approaches and combine it with volume or moving averages for confirmation. The tool is applicable to diverse markets including Forex, indices, commodities, stocks, and cryptocurrencies, supporting symbols like EURUSD, GBPUSD, XAUUSD, NAS100, and BTCUSD.
Key features include simplification of market noise, identification of support and resistance levels, trend confirmation, and assistance with pullback entries. It supports multiple trading styles across various timeframes: scalping (1–5 minutes), intraday trading (15 minutes to 1 hour), and swing trading (4 hours to daily). Users can adjust the indicator’s sensitivity to suit different trading approaches and combine it with volume or moving averages for confirmation. The tool is applicable to diverse markets including Forex, indices, commodities, stocks, and cryptocurrencies, supporting symbols like EURUSD, GBPUSD, XAUUSD, NAS100, and BTCUSD.
Indicator profile
Customer reviews
4.6
Reviews: 3
5 | 67 % | |
4 | 33 % | |
3 | 0 % | |
2 | 0 % | |
1 | 0 % |
Customer reviews
September 24, 2025
The tool feels better once it makes forced ideas less tempting, and a 1R exit plan makes review easier.
September 20, 2025
September 17, 2025
Discussion
FAQ
Signal
Indices
Commodities
GBPUSD
RSI
Bollinger
Scalping
AI
XAUUSD
NAS100
MACD
BTCUSD
Forex
Breakout
EURUSD
NZDUSD
Martingale
Prop
Supertrend
Crypto
Grid
Stocks
ATR
USDJPY
VWAP
Products available through cTrader Store, including trading bots, indicators and plugins, are provided by third-party developers and made available for informational and technical access purposes only. cTrader Store is not a broker and does not provide investment advice, personal recommendations or any guarantee of future performance.


Price
Since 29/05/2025
3.04M
Traded volume
45.22K
Pips won
29
Sales
771
Free installs