

FractalArrowBuySell
Indicator
13 purchases
Version 1.0, Jun 2025
Windows, Mac
4.3
Reviews: 3

Since 29/05/2025
3.05M
Traded volume
68.12K
Pips won
29
Sales
887
Free installs
Description
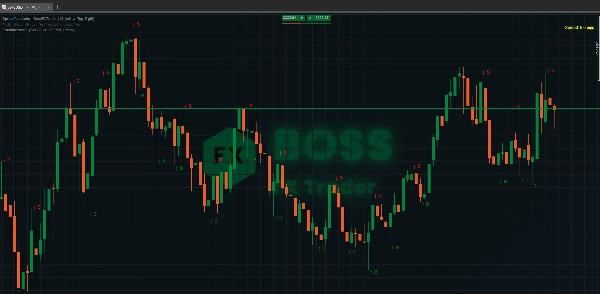
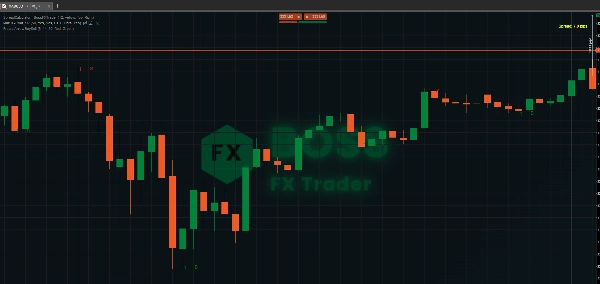
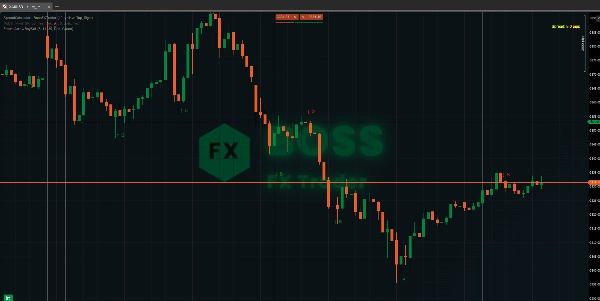
Fractal Arrow Buy and Sell Indicator is signaling the right approach on the market. Minimize false signals at entry and exit.
Last 7 of 10 copies will be sold at 20. The original price will be 39.
🖼️ Why is using this very important ?:
Summary
AI summary
Fractal Arrow Buy and Sell Indicator provides visual signals for market entry and exit by displaying arrows and labels on price charts. It aims to reduce false signals through adjustable parameters including fractal period, arrow size, arrow offset label, and arrow color. The indicator marks buy signals with a green upward arrow below the candle accompanied by a green "B," and sell signals with a red downward arrow above the candle plus a red "S" slightly to the right.
The indicator supports multiple timeframes with recommended fractal settings and gain targets:
- 3-5 minutes timeframe: fractal set to 2, target gain 60-120 pips
- 15 minutes timeframe: fractal set to 5, target gain 300-500 pips
- 30 minutes timeframe: fractal set to 8, target gain 600-700 pips
Users can edit the instance name for easier identification. The indicator is designed to assist traders in identifying optimal buy and sell points by leveraging fractal analysis and customizable visual cues.
The indicator supports multiple timeframes with recommended fractal settings and gain targets:
- 3-5 minutes timeframe: fractal set to 2, target gain 60-120 pips
- 15 minutes timeframe: fractal set to 5, target gain 300-500 pips
- 30 minutes timeframe: fractal set to 8, target gain 600-700 pips
Users can edit the instance name for easier identification. The indicator is designed to assist traders in identifying optimal buy and sell points by leveraging fractal analysis and customizable visual cues.
Indicator profile
Discussion
Customer reviews
4.3
Reviews: 3
5 | 33 % | |
4 | 67 % | |
3 | 0 % | |
2 | 0 % | |
1 | 0 % |
Customer reviews
June 28, 2025
Useful when measured around swing point analysis. The useful part is reviewing reversals, pullbacks and swing zones, with the numbers checked before scaling. I would test 20 swing signals and ignore setups where the stop is wider than the 1.5R target. The level is useful when it supports the market story.
June 27, 2025
June 27, 2025
Cleaner way to review if the trader wants it helps identify turning points and cleaner structure. It works best as support, not a final decision maker. Swing points look better after 3 pivots, especially when the 0.5 Fib area agrees with structure. the signal still needs broader context.
FAQ
Signal
Products available through cTrader Store, including trading bots, indicators and plugins, are provided by third-party developers and made available for informational and technical access purposes only. cTrader Store is not a broker and does not provide investment advice, personal recommendations or any guarantee of future performance.


























Price
Since 29/05/2025
3.05M
Traded volume
68.12K
Pips won
29
Sales
887
Free installs